Scipy Lecture Notes学习笔记(一)Getting started with Python for science 1.4. Matplotlib: plotting
摘要:
python 绘图,散点图scatter,饼图pie,一张图像上面显示多图subplot(2, 3, 4),3-D绘图plot_surface,向量图quiver,极坐标图http://www.scipy-lectures.org/intro/matplotlib/auto_examples/plot_polar.html#sphx-glr-intro-matplotlib-auto-examples-plot-polar-py 等等
Matplotlib可能是2D图形最常用的Python包。它提供了一种快速的方式来以可视化方式从Python中获取数据,并以多种格式呈现出版质量数据。我们将以交互模式探索matplotlib,涵盖大多数常见的案例。
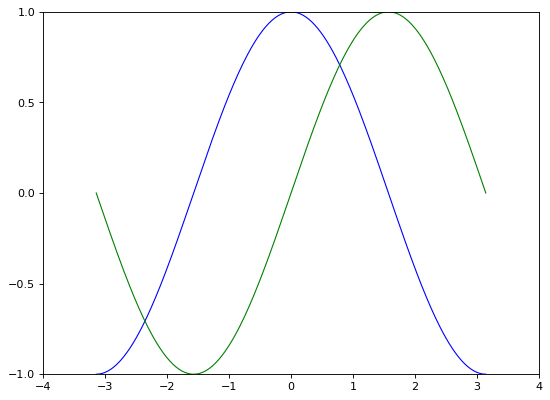
import numpy as np
import matplotlib.pyplot as plt

# Create a figure of size 8x6 inches, 80 dots per inch
plt.figure(figsize=(8, 6), dpi=80)

# Create a new subplot from a grid of 1x1
plt.subplot(1, 1, 1)

X = np.linspace(-np.pi, np.pi, 256, endpoint=True)
C, S = np.cos(X), np.sin(X)

# Plot cosine with a blue continuous line of width 1 (pixels)
plt.plot(X, C, color="blue", linewidth=1.0, linestyle="-")

# Plot sine with a green continuous line of width 1 (pixels)
plt.plot(X, S, color="green", linewidth=1.0, linestyle="-")

# Set x limits
plt.xlim(-4.0, 4.0)

# Set x ticks
plt.xticks(np.linspace(-4, 4, 9, endpoint=True))

# Set y limits
plt.ylim(-1.0, 1.0)

# Set y ticks
plt.yticks(np.linspace(-1, 1, 5, endpoint=True))

# Save figure using 72 dots per inch
# plt.savefig("exercise_2.png", dpi=72)

# Show result on screen
plt.show()
具体颜色设置,别的画图指令可以见原教程
http://www.scipy-lectures.org/intro/matplotlib/index.html