左右子图
有时候,选择两个不同的图标类型来可视化数据可能是必要的或者是理想的.利用子图方法:
#!/etc/bin/python
#coding=utf-8
import numpy as np
import matplotlib as mpl
import matplotlib.pyplot as plt

np.random.seed(2000)
y = np.random.standard_normal((10, 2))

plt.figure(figsize=(10,5))
plt.subplot(121)  #两行一列,第一个图
plt.plot(y[:,0], lw = 1.5,label = '1st')
plt.plot(y[:,0], 'ro')
plt.grid(True)
plt.legend(loc = 0) #图例位置自动
plt.axis('tight')
plt.xlabel('index')
plt.ylabel('value')
plt.title('1st Data Set')

plt.subplot(122)
plt.bar(np.arange(len(y)), y[:,1],width=0.5, color='g',label = '2nc')
plt.grid(True)
plt.legend(loc=0)
plt.axis('tight')
plt.xlabel('index')
plt.title('2nd Data Set')
plt.show()

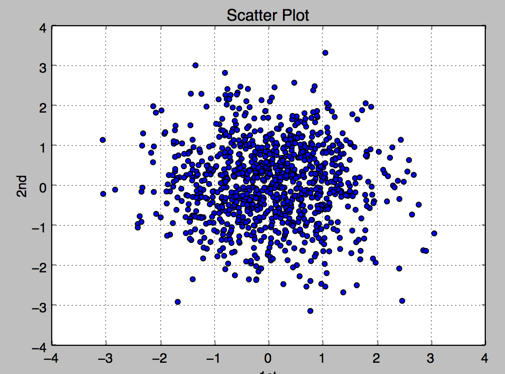
其他绘图样式,散点图,直方图等
#!/etc/bin/python
#coding=utf-8
import numpy as np
import matplotlib as mpl
import matplotlib.pyplot as plt

np.random.seed(2000)
y = np.random.standard_normal((1000, 2))
plt.figure(figsize=(7,5))
plt.scatter(y[:,0],y[:,1],marker='o')
plt.grid(True)
plt.xlabel('1st')
plt.ylabel('2nd')
plt.title('Scatter Plot')
plt.show()
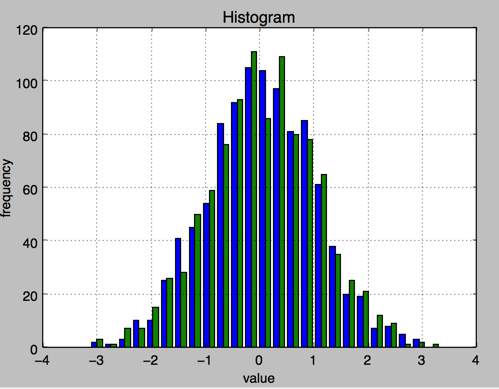
2.直方图 plt.hist
#!/etc/bin/python
#coding=utf-8
import numpy as np
import matplotlib as mpl
import matplotlib.pyplot as plt

np.random.seed(2000)
y = np.random.standard_normal((1000, 2))
plt.figure(figsize=(7,5))
plt.hist(y,label=['1st','2nd'],bins=25)
plt.grid(True)
plt.xlabel('value')
plt.ylabel('frequency')
plt.title('Histogram')
plt.show()