# -*- coding:utf-8 -*-
import numpy as np
import matplotlib.pyplot as plt
from sklearn import svm, datasets
"""
生成分类面数据点
"""
def make_meshgrid(x, y, h=.02):
"""Create a mesh of points to plot in
Parameters
----------
x: data to base x-axis meshgrid on
y: data to base y-axis meshgrid on
h: stepsize for meshgrid, optional
Returns
-------
xx, yy : ndarray
"""
x_min, x_max = x.min() - 1, x.max() + 1
y_min, y_max = y.min() - 1, y.max() + 1
xx, yy = np.meshgrid(np.arange(x_min, x_max, h),
np.arange(y_min, y_max, h))
return xx, yy
"""
利用分类器对数据点进行分类
"""
def plot_contours(ax, clf, xx, yy, **params):
"""Plot the decision boundaries for a classifier.
Parameters
----------
ax: matplotlib axes object
clf: a classifier
xx: meshgrid ndarray
yy: meshgrid ndarray
params: dictionary of params to pass to contourf, optional
"""
Z = clf.predict(np.c_[xx.ravel(), yy.ravel()])
Z = Z.reshape(xx.shape)
out = ax.contourf(xx, yy, Z, **params)
return out
"""
实验目的:支持向量机实验
数据集:本程序使用Iris数据集是常用的分类实验数据集,由Fisher, 1936收集整理。
Iris也称鸢尾花卉数据集,是一类多重变量分析的数据集。
数据集包含150个数据集,分为3类,每类50个数据,每个数据包含4个属性。
可通过花萼长度,花萼宽度,花瓣长度,花瓣宽度4个属性预测鸢尾花卉属于
(Setosa,Versicolour,Virginica)三个种类中的哪一类。
注意:为了方面可视化,实验中取Iris数据集中前两维特征进行模型训练
"""
# import some data to play with
iris = datasets.load_iris()
# Take the first two features. We could avoid this by using a two-dim dataset
X = iris.data[:, :2]
y = iris.target
"""
函数说明:
class sklearn.svm.SVC(C=1.0, kernel=’rbf’, degree=3, gamma=’auto’,
coef0=0.0, shrinking=True, probability=False, tol=0.001, cache_size=200,
class_weight=None, verbose=False, max_iter=-1, decision_function_shape=’ovr’,
random_state=None)
参数说明:
http://scikit-learn.org/stable/modules/generated/sklearn.svm.SVC.html#sklearn.svm.SVC
"""
# we create an instance of SVM and fit out data. We do not scale our
# data since we want to plot the support vectors
C = 1.0 # SVM regularization parameter
models = (svm.SVC(kernel='linear', C=C),
svm.LinearSVC(C=C),
svm.SVC(kernel='rbf', gamma=0.7, C=C),
svm.SVC(kernel='poly', degree=3, C=C))
models = (clf.fit(X, y) for clf in models)
# title for the plots
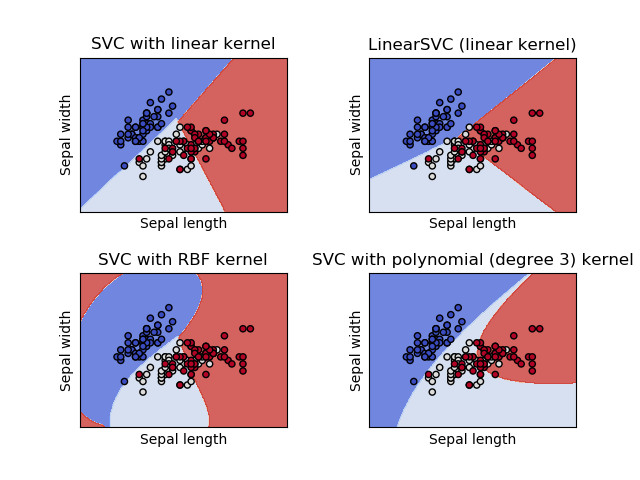
titles = ('SVC with linear kernel',
'LinearSVC (linear kernel)',
'SVC with RBF kernel',
'SVC with polynomial (degree 3) kernel')
# Set-up 2x2 grid for plotting.
fig, sub = plt.subplots(2, 2)
plt.subplots_adjust(wspace=0.4, hspace=0.4)
X0, X1 = X[:, 0], X[:, 1]
xx, yy = make_meshgrid(X0, X1)
"""
对平面内的点集分类并进行可视化处理
"""
for clf, title, ax in zip(models, titles, sub.flatten()):
plot_contours(ax, clf, xx, yy,
cmap=plt.cm.coolwarm, alpha=0.8)
ax.scatter(X0, X1, c=y, cmap=plt.cm.coolwarm, s=20, edgecolors='k')
ax.set_xlim(xx.min(), xx.max())
ax.set_ylim(yy.min(), yy.max())
ax.set_xlabel('Sepal length')
ax.set_ylabel('Sepal width')
ax.set_xticks(())
ax.set_yticks(())
ax.set_title(title)
plt.show()