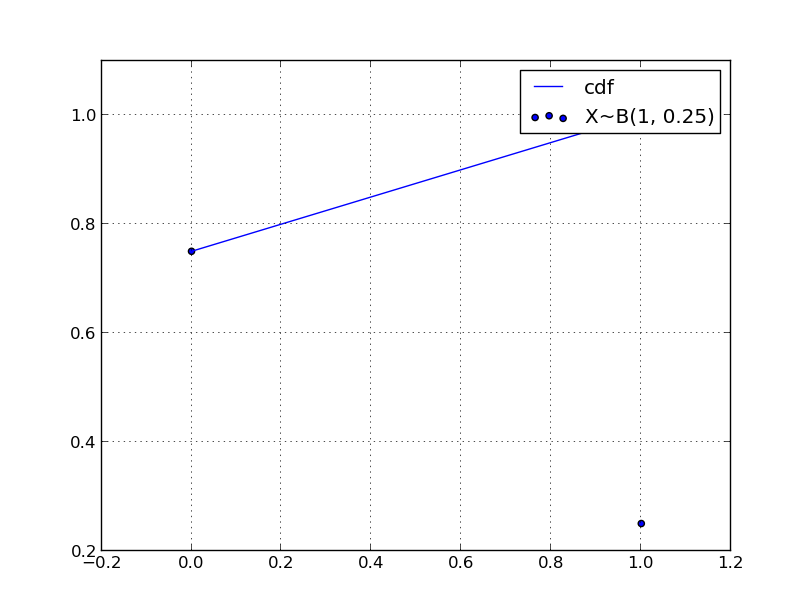
# --*-- coding:utf-8 --*--
import matplotlib.pyplot as plt

# 随机变量x只能取0,1 我们称X服从以P为参数的(0-1)分布 或两点分布


p = float(1) / 4
x = [0, 1]
y = [1-p, p]
cdf = [1-p, 1]

fig = plt.figure()
ax = fig.add_subplot(111)
ax.scatter(x, y, label='X~B(%s, %s)' % (1, p))
ax.plot(x, cdf, label='cdf')

plt.grid()
plt.legend()
plt.show()
