Prometheus介绍
Prometheus 是一款用于事件监控告警的开源免费应用程序, 采用Go编写。
Prometheus 工作时通过HTTP的方式周期性抓取被监控组件的性能数据,任意想要被监控的组件只需要提供对应的HTTP接口即可接入监控,不需要额外的SDK支持或者其他的集成过程,输出被监控组件性能信息的HTTP接口被叫做exporter。
其中常用的exporter有node_exporter,可以用来输出服务器的CPU使用率,磁盘占用情况,网络带宽使用情况,等基本性能信息。
Grafana 介绍
Grafana是一个跨平台的开源的度量分析和可视化工具,可以通过将采集的数据查询然后可视化的展示,并及时通知。它主要有以下六大特点:
1、展示方式:快速灵活的客户端图表,面板插件有许多不同方式的可视化指标和日志,官方库中具有丰富的仪表盘插件,比如热图、折线图、图表等多种展示方式;
2、数据源:Graphite,InfluxDB,OpenTSDB,Prometheus,Elasticsearch,CloudWatch和KairosDB等;
3、通知提醒:以可视方式定义最重要指标的警报规则,Grafana将不断计算并发送通知,在数据达到阈值时通过Slack、PagerDuty等获得通知;
4、混合展示:在同一图表中混合使用不同的数据源,可以基于每个查询指定数据源,甚至自定义数据源;
5、注释:使用来自不同数据源的丰富事件注释图表,将鼠标悬停在事件上会显示完整的事件元数据和标记;
6、过滤器:Ad-hoc过滤器允许动态创建新的键/值过滤器,这些过滤器会自动应用于使用该数据源的所有查询。
node_exporter 安装
添加用户
useradd --no-create-home --shell /bin/false node_exporter
下载安装
curl -fsSL https://github.com/prometheus/node_exporter/releases/download/v1.0.1/node_exporter-1.0.1.linux-amd64.tar.gz
  | sudo tar -zxvf - -C /usr/local/bin --strip-components=1 node_exporter-1.0.1.linux-amd64/node_exporter
  && sudo chown node_exporter:node_exporter /usr/local/bin/node_exporter
创建服务
tee /etc/systemd/system/node_exporter.service <<"EOF"
[Unit]
Description=Node Exporter

[Service]
User=node_exporter
Group=node_exporter
EnvironmentFile=-/etc/sysconfig/node_exporter
ExecStart=/usr/local/bin/node_exporter $OPTIONS

[Install]
WantedBy=multi-user.target
EOF
开机自启并启动服务
systemctl daemon-reload &&
systemctl start node_exporter &&
systemctl status node_exporter &&
systemctl enable node_exporter
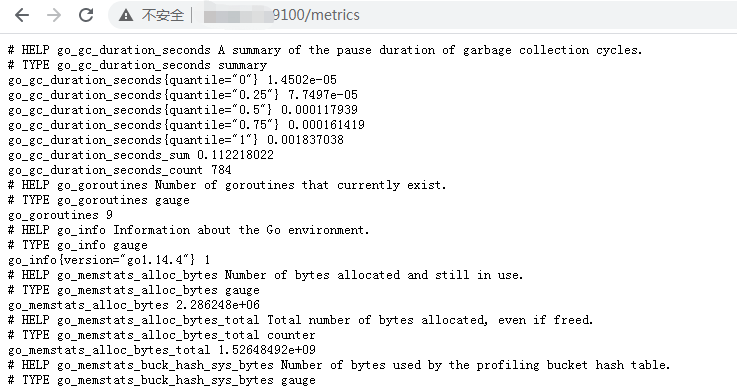
node_exporter服务默认监控在9100端口,访问http://服务IP:9100/metrics 正常情况下出现如下画面
docker安装Prometheus + Grafana
Prometheus 配置文件 prometheus.yml 如下
# my global config
global:
  scrape_interval:     15s # Set the scrape interval to every 15 seconds. Default is every 1 minute.
  evaluation_interval: 15s # Evaluate rules every 15 seconds. The default is every 1 minute.
  # scrape_timeout is set to the global default (10s).

# Alertmanager configuration
alerting:
  alertmanagers:
  - static_configs:
    - targets:
      # - alertmanager:9093

# Load rules once and periodically evaluate them according to the global 'evaluation_interval'.
rule_files:
  # - "first_rules.yml"
  # - "second_rules.yml"

# A scrape configuration containing exactly one endpoint to scrape:
# Here it's Prometheus itself.
scrape_configs:
  # The job name is added as a label `job=<job_name>` to any timeseries scraped from this config.
  - job_name: 'prometheus'

    # metrics_path defaults to '/metrics'
    # scheme defaults to 'http'.

    static_configs:
    - targets: ['localhost:9090']

   # 主要是新增了node_exporter的job,如果有多个node_exporter,在targets数组后面加即可

  - job_name: 'node_exporter'
    static_configs:
      - targets: ['服务器IP:9100']
docker-compose.yml 文件
version: '3'
services:
    grafana:
        image: grafana/grafana
        container_name: grafana
        restart: always
        ports:
          - "3000:3000"

    prometheus:
        image: prom/prometheus
        container_name: prometheus
        restart: always
        ports:
          - "9090:9090"
        volumes:
          - ./prometheus.yml:/etc/prometheus/prometheus.yml
docker-compose up -d 启动
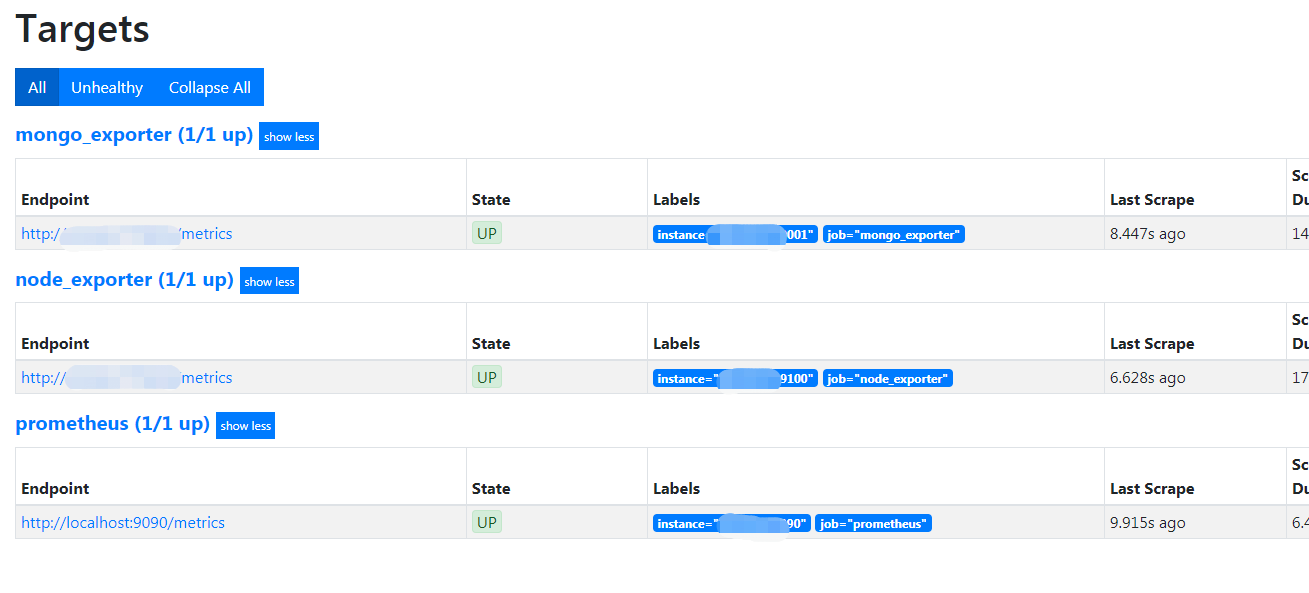
访问http://docker服务器IP:9090/targets 应该出现如下页面
创建Dashboard
登录进Grafana 3000端口, 默认凭证(admin/admin)
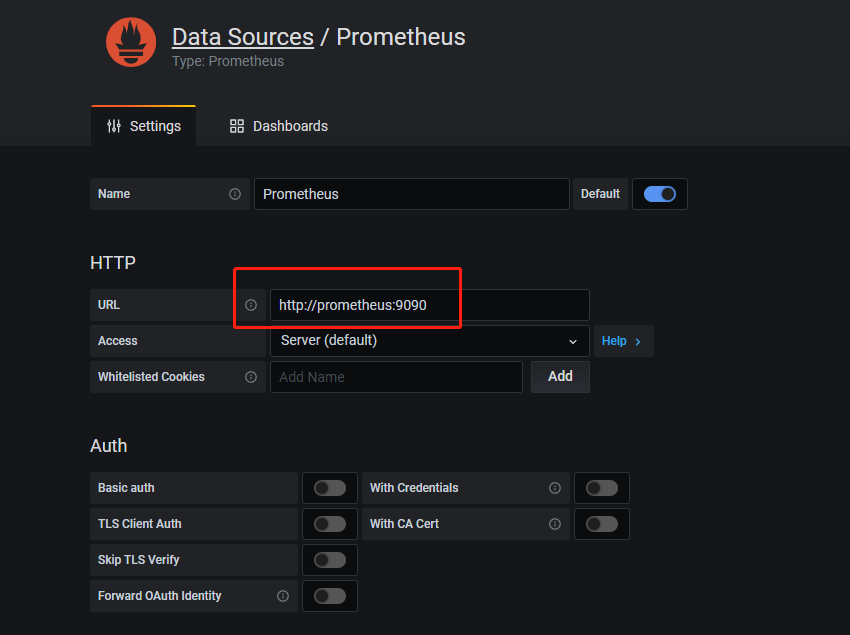
创建数据源, 由于是Docker运行的,可以填服务名称。
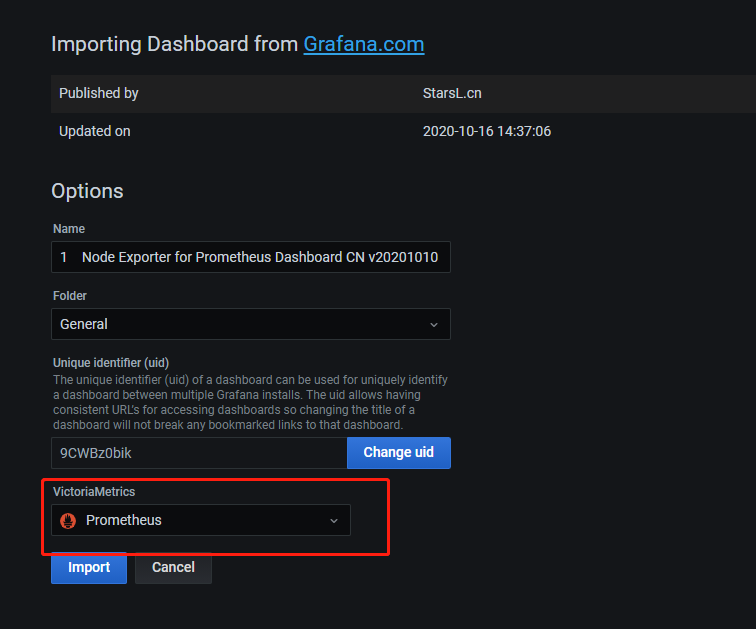
创建Dashboard 时候,导入以下模版即可,可以填入URL, 最后选择创建的数据源即可。
https://grafana.com/api/dashboards/8919/revisions/24/download
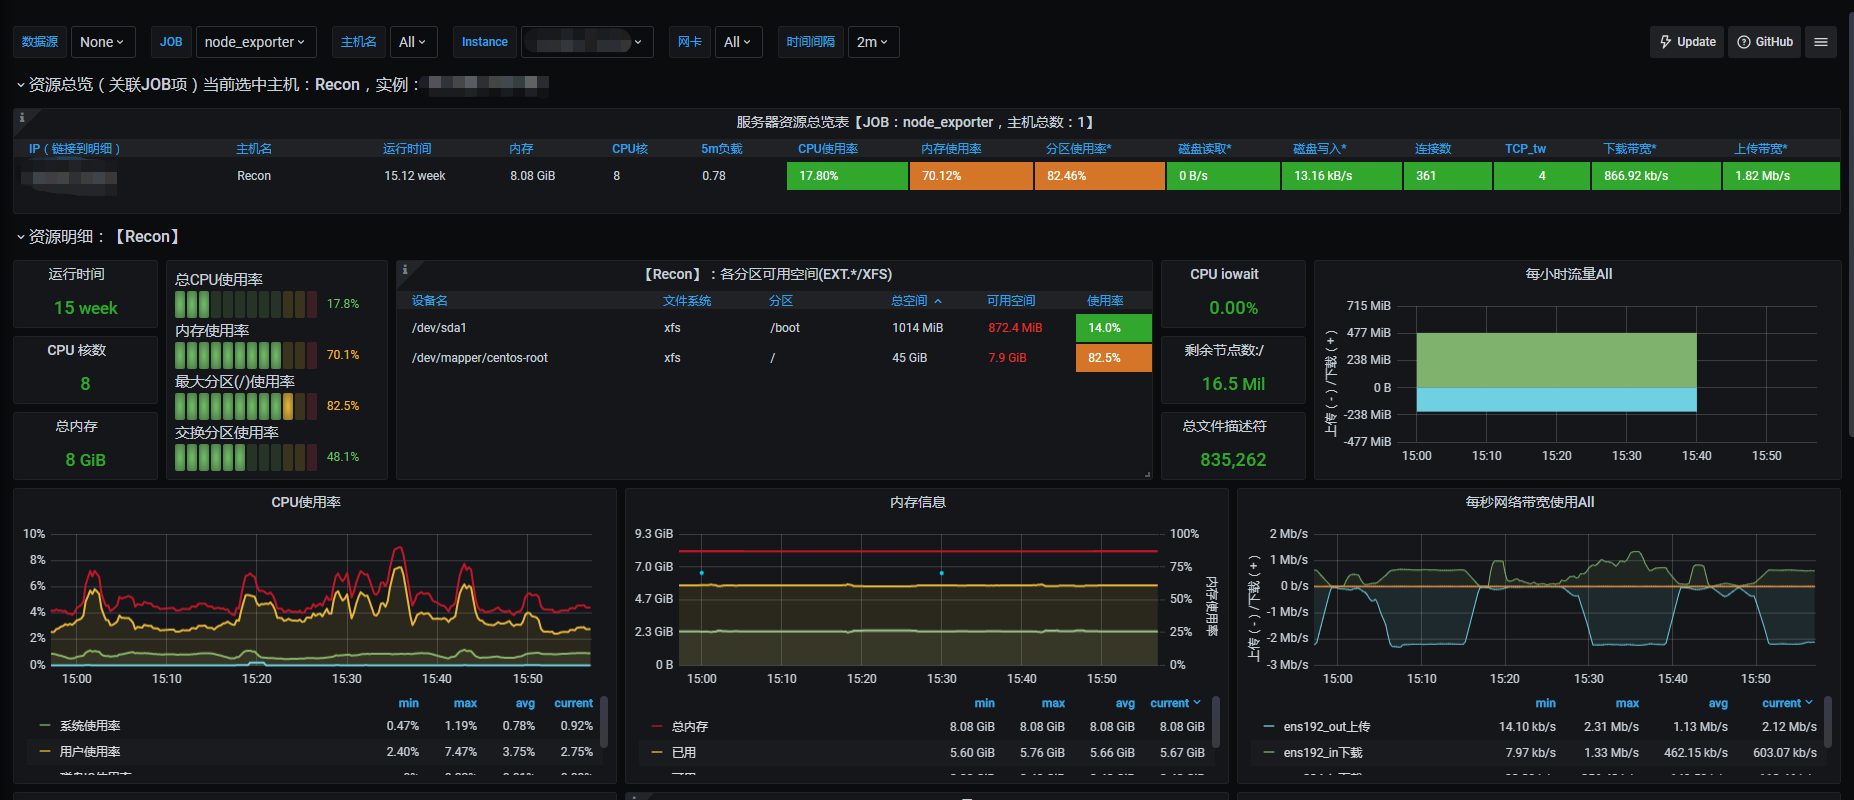
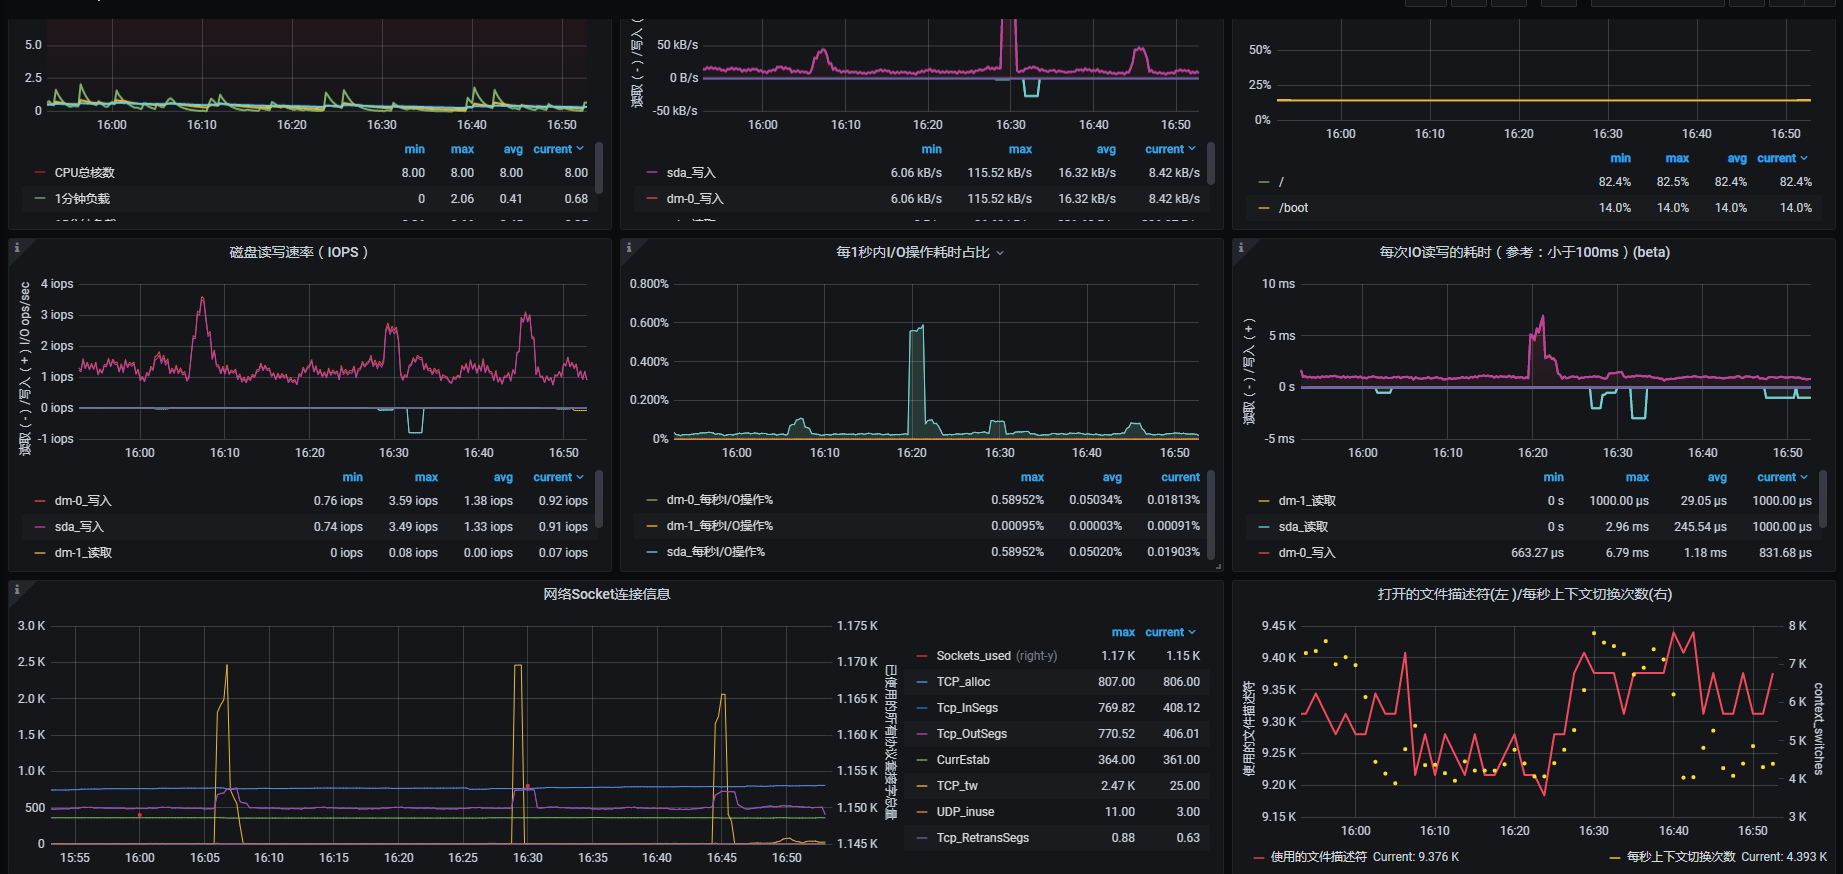
展示
主机性能可视化
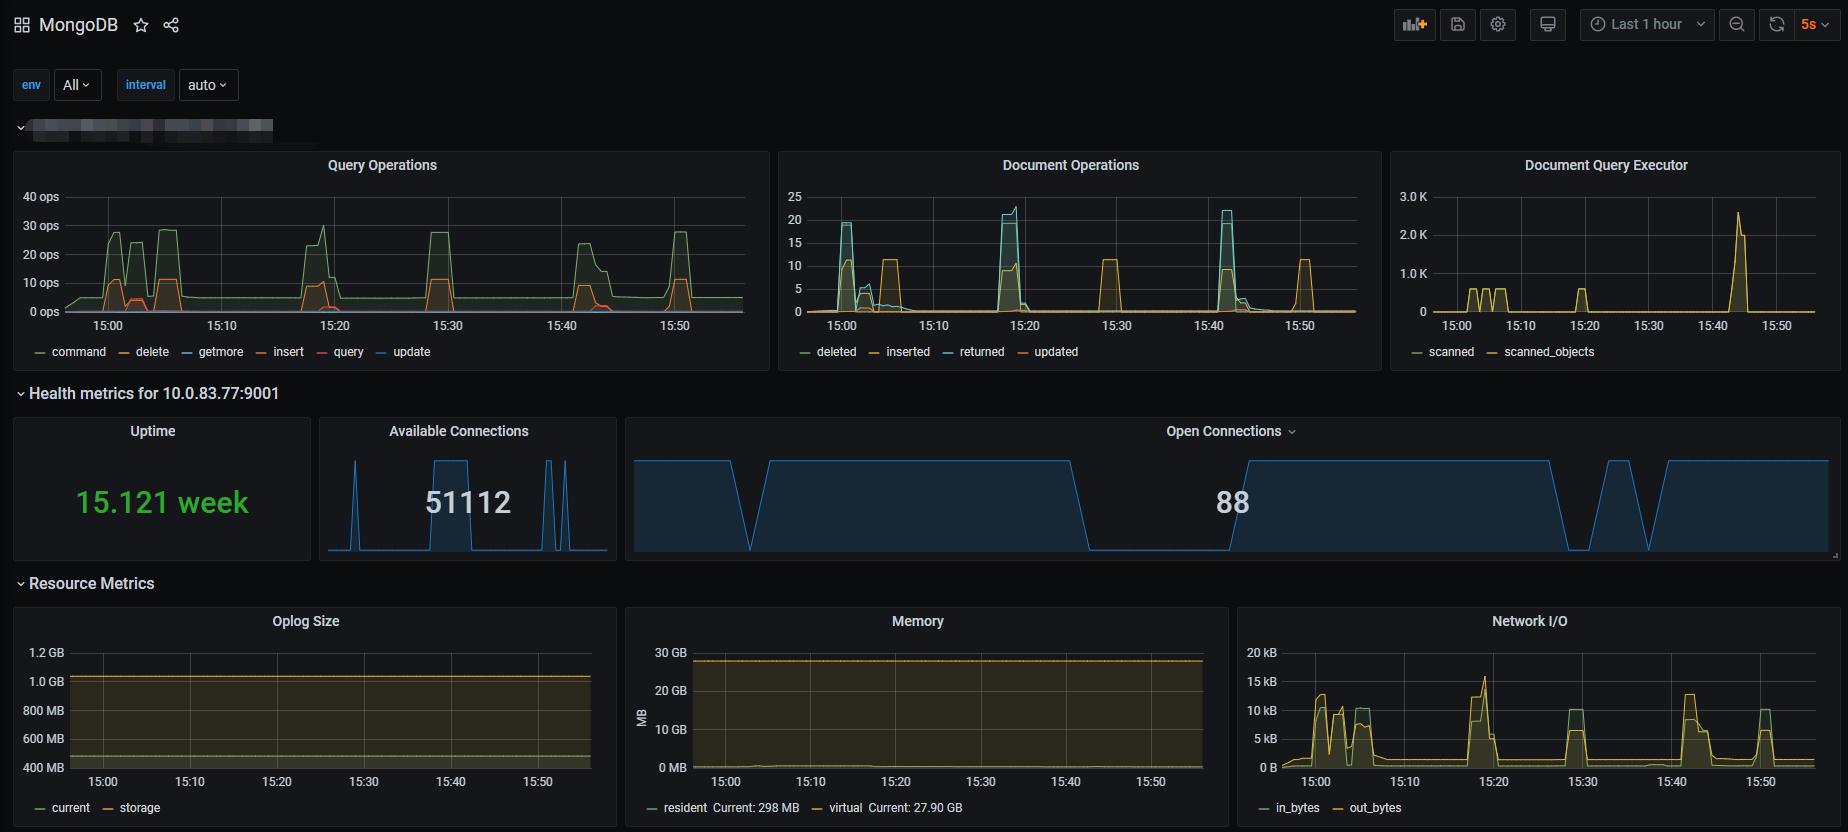
Mongo性能展示
参考
https://www.jianshu.com/p/821bf7d2bbef
https://grafana.com/grafana/dashboards/8919
https://gist.github.com/jarek-przygodzki/735e15337a3502fea40beba27e193b04