笔者在使用的环境是
wamp3.1.6和phpstorm2018,php选择的环境是php7.2
1. 在php.ini中添加xdebug的配置信息
首先建议是先找对php.ini的位置,可以在phpinfo()方法中找到php.ini文件的位置
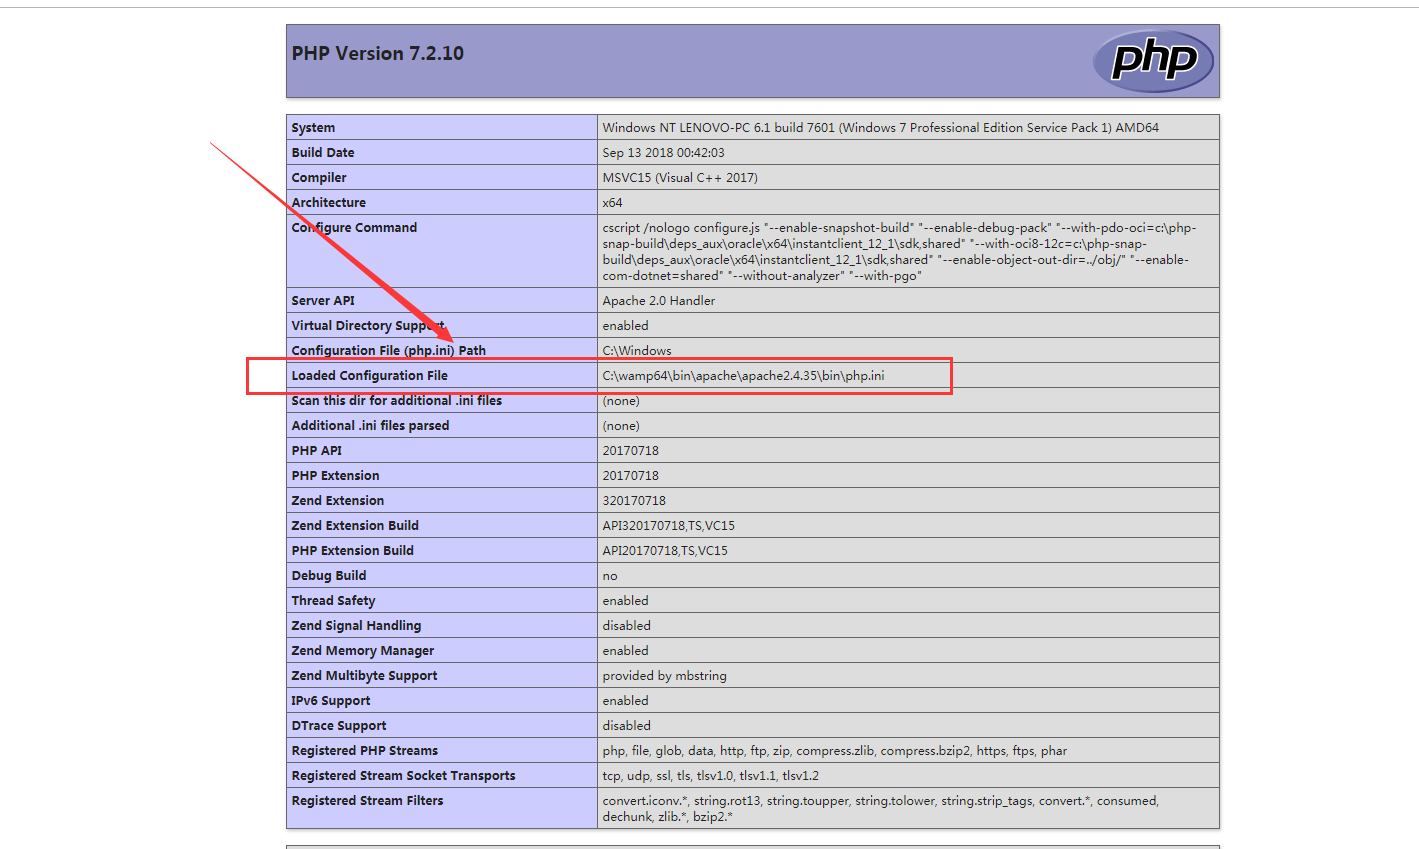
用编辑器打开php.ini在末尾追加关于xdebug的配置
[XDebug]

xdebug.profiler_output_dir="D:Logxdebug"
xdebug.trace_output_dir="D:Logxdebug"
xdebug.remote_log="D:/Log/xdebug.log"
zend_extension="C:/wamp64/bin/php/php7.2.10/zend_ext/php_xdebug-2.6.1-7.2-vc15-x86_64.dll"

;允许收集传递给函数的参数变量
xdebug.collect_params=on

;允许收集函数调用的返回值
xdebug.collect_return=on

;启用代码自动跟踪
xdebug.auto_trace=on

;性能优化,本文用不到,选择关闭(不关闭,会以约每分钟几百M的速度产生大量日志文件,用不上一天你的硬盘就哭了)
xdebug.profiler_enable = Off ;关掉性能检测分析

;指定性能分析信息文件的名称
xdebug.profiler_output_name = cachegrind.out.%t.%p

;远程端口,指phpstorm配置的端口
xdebug.remote_port=9001

;指定远程调试的处理协议
xdebug.remote_handler = "dbgp"

;是否允许远程终端,这个必须开启
xdebug.remote_enable = on
;远程IP地址,就算你phpstorm所在的IP。如果你是在本地的话直接写127.0.0.1就可以了
xdebug.remote_host=127.0.0.1
xdebug.idekey = PHPSTORM ;这里是调试器的关键字
xdebug.remote_autostart=1
xdebug.remote_mode=req
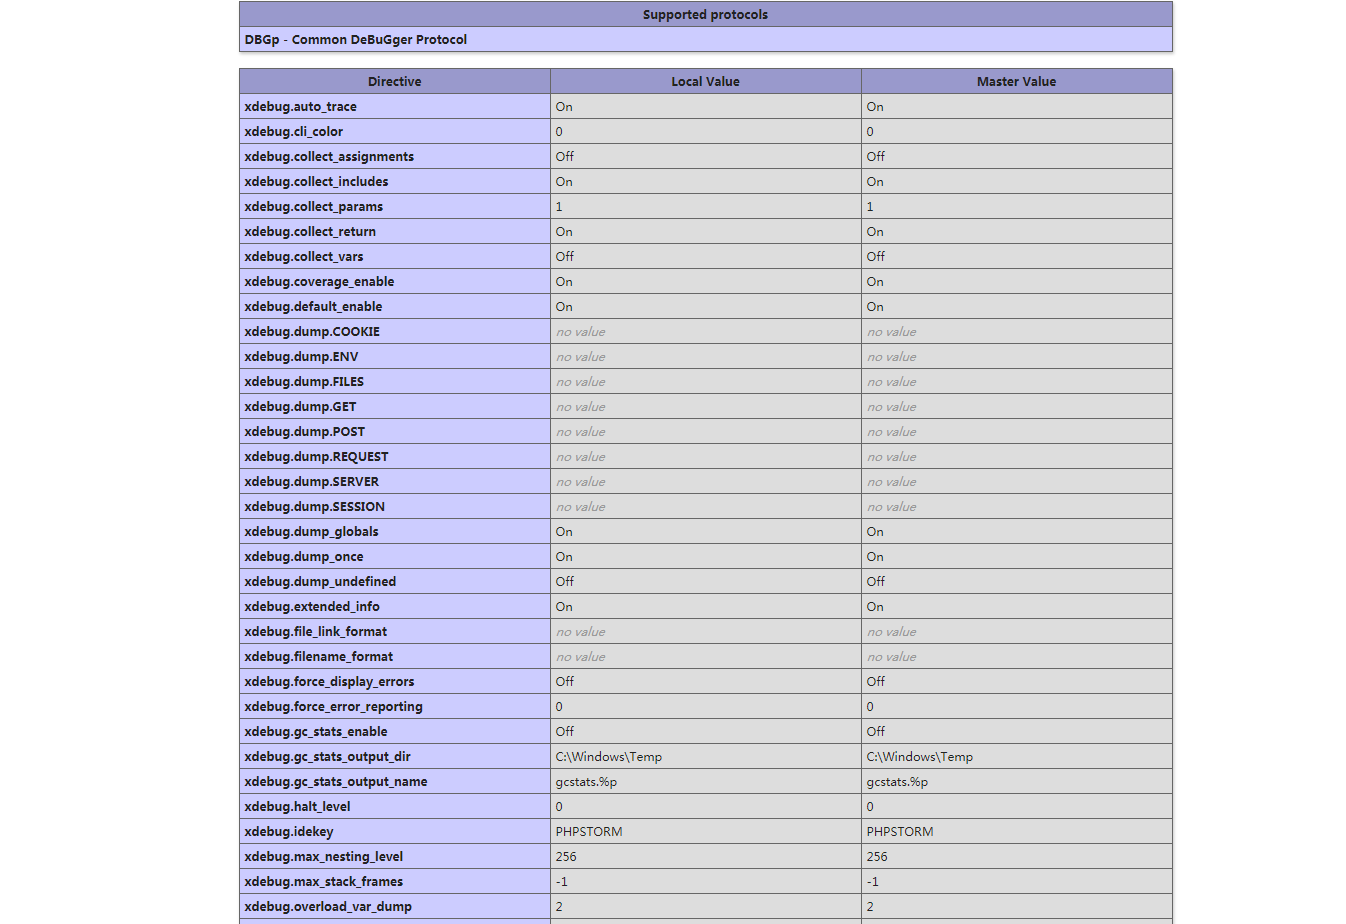
重启wamp 查看配置是否生效
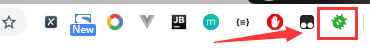
2. 在谷歌浏览器中添加xdebug插件
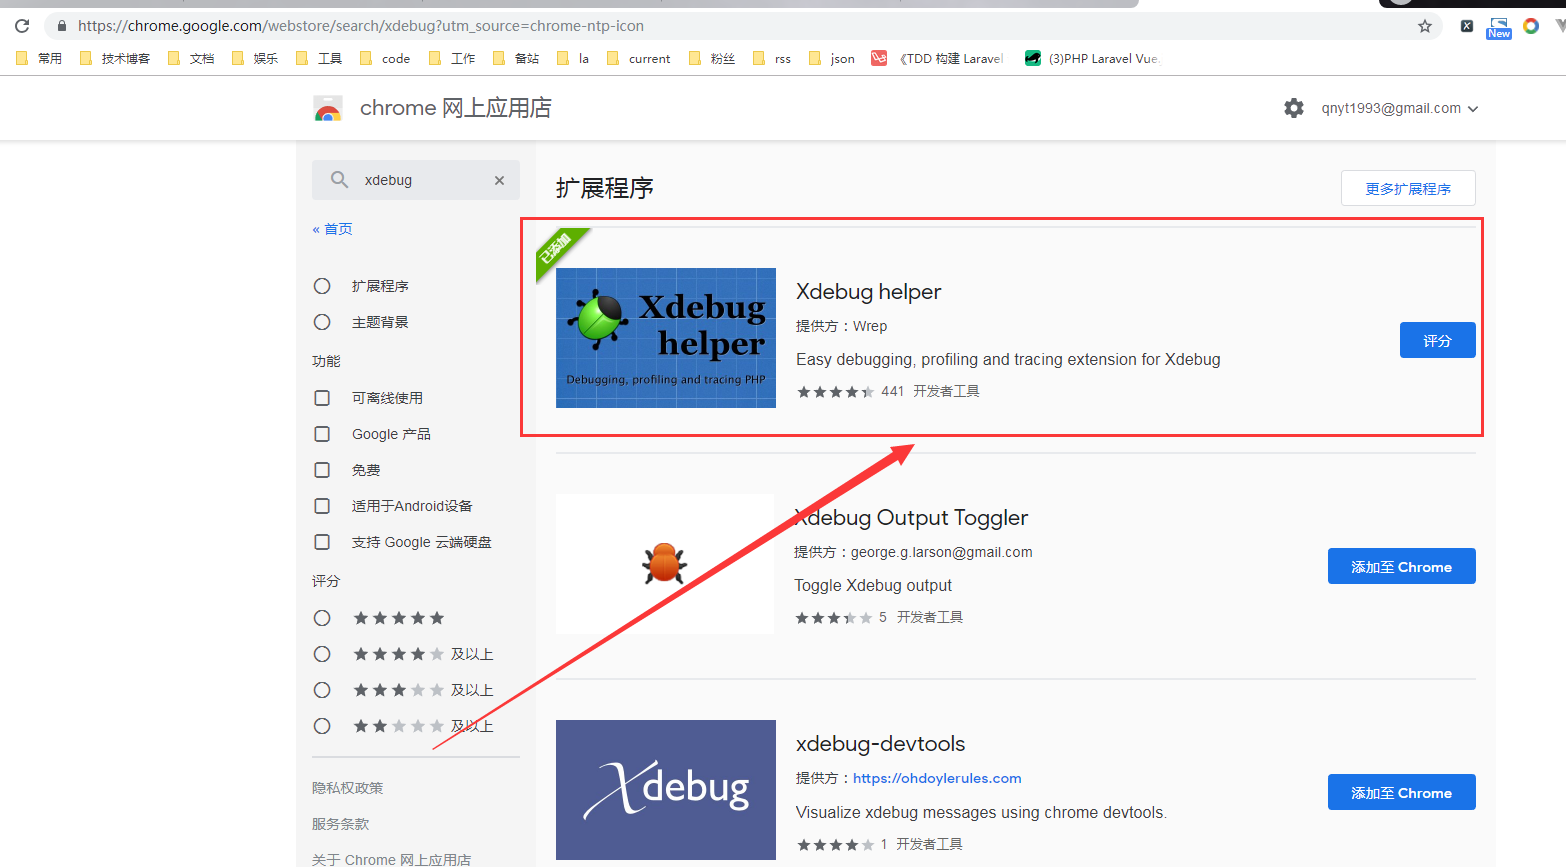
添加完后的效果如图所示,在插件栏中多了一个小甲虫
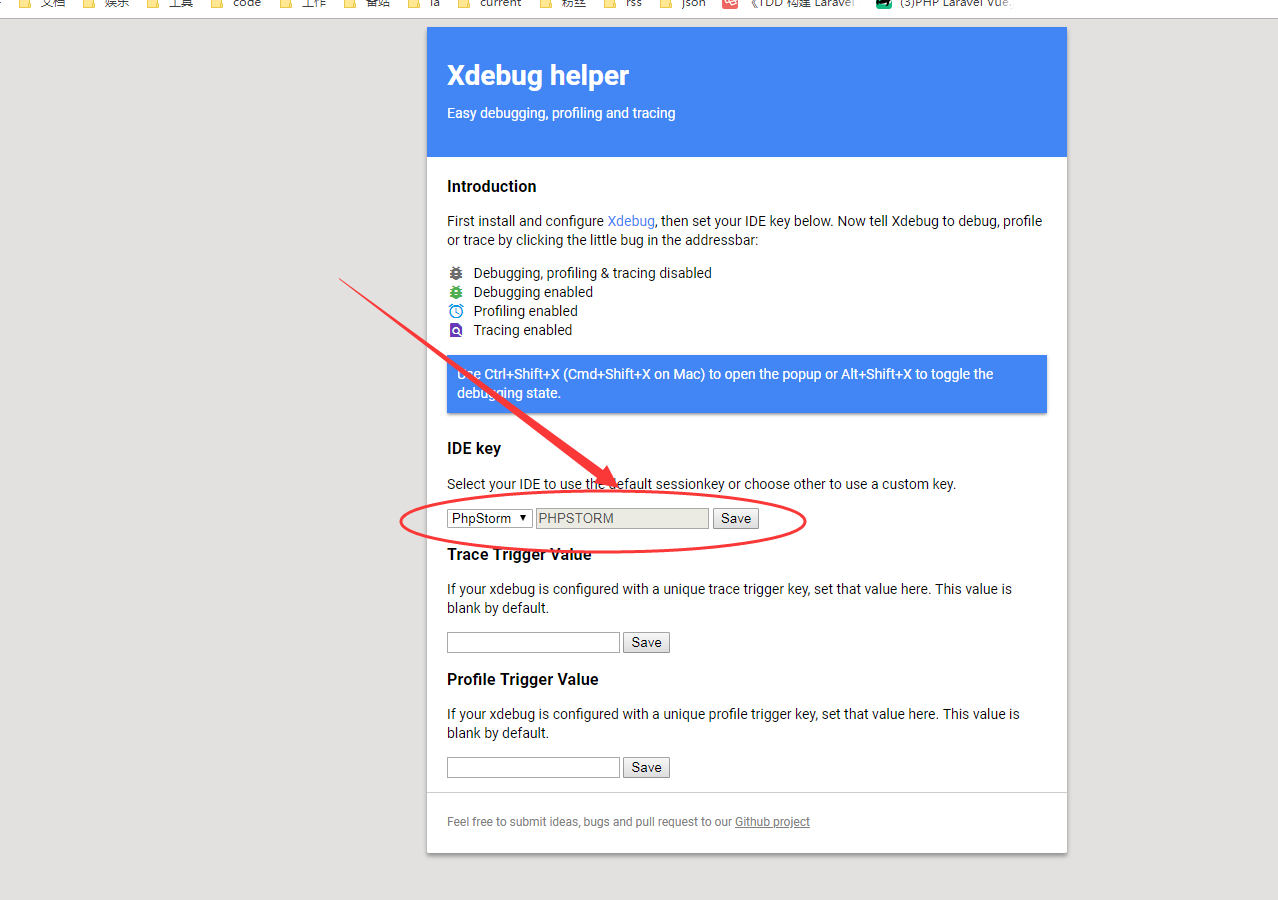
这时右击小甲虫点击选项,选择phpstorm 点击save
3. 配置phpstorm
配置本地执行php.exe的位置和检查php语法的版本

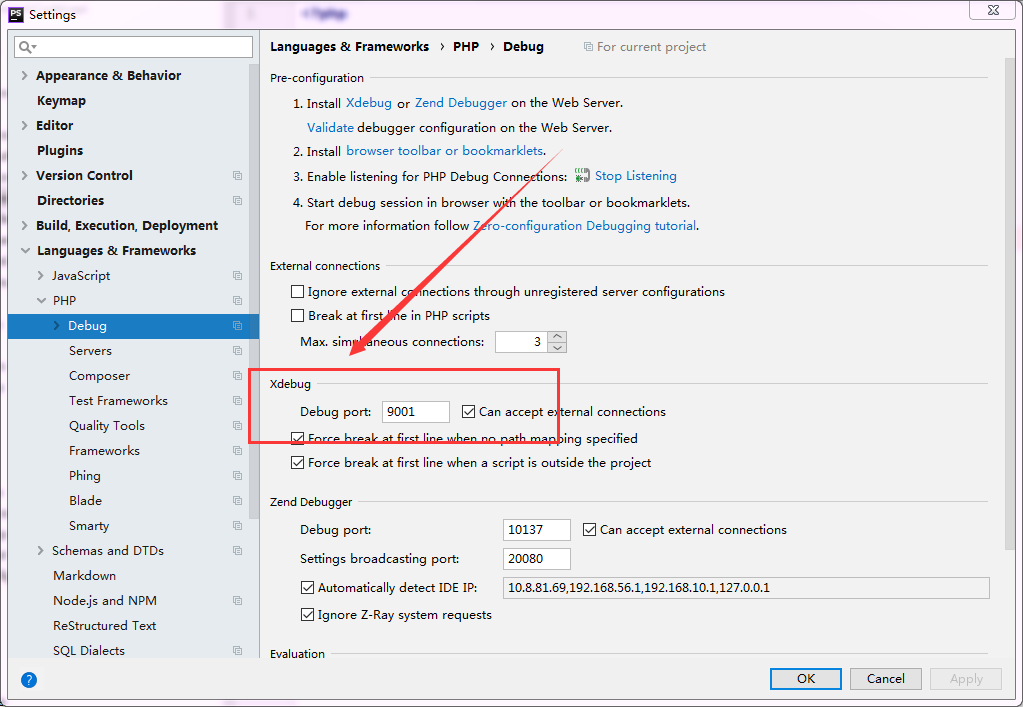
配置Debug :Languages & Frameworks -> PHP -> Debug,只需要把端口改为9001,和xdebug的配置保持一致
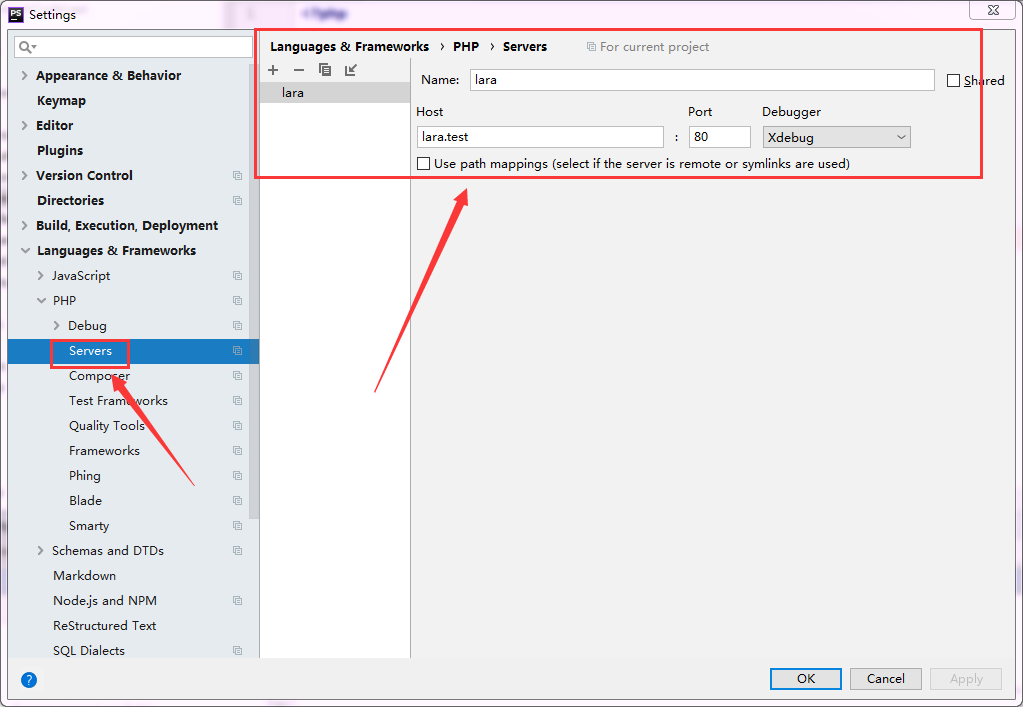
.配置Server(就在Debug下面一个) :Languages & Frameworks -> PHP -> Servers,新建一台本地服务器(绿色加号),填写服务器名字以及host,确认debugger是xdebug
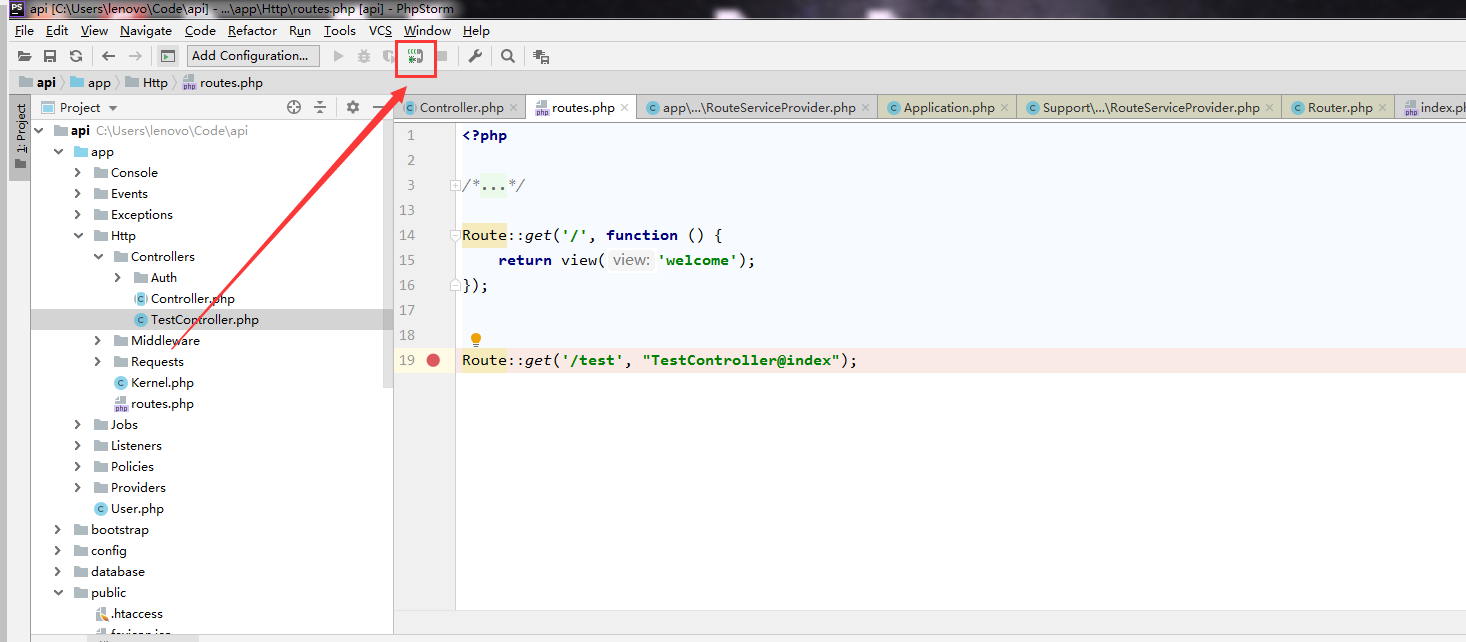
启动xdebug helper:点击xdebug helper图标,选择Debug项,灰色图标变成绿色
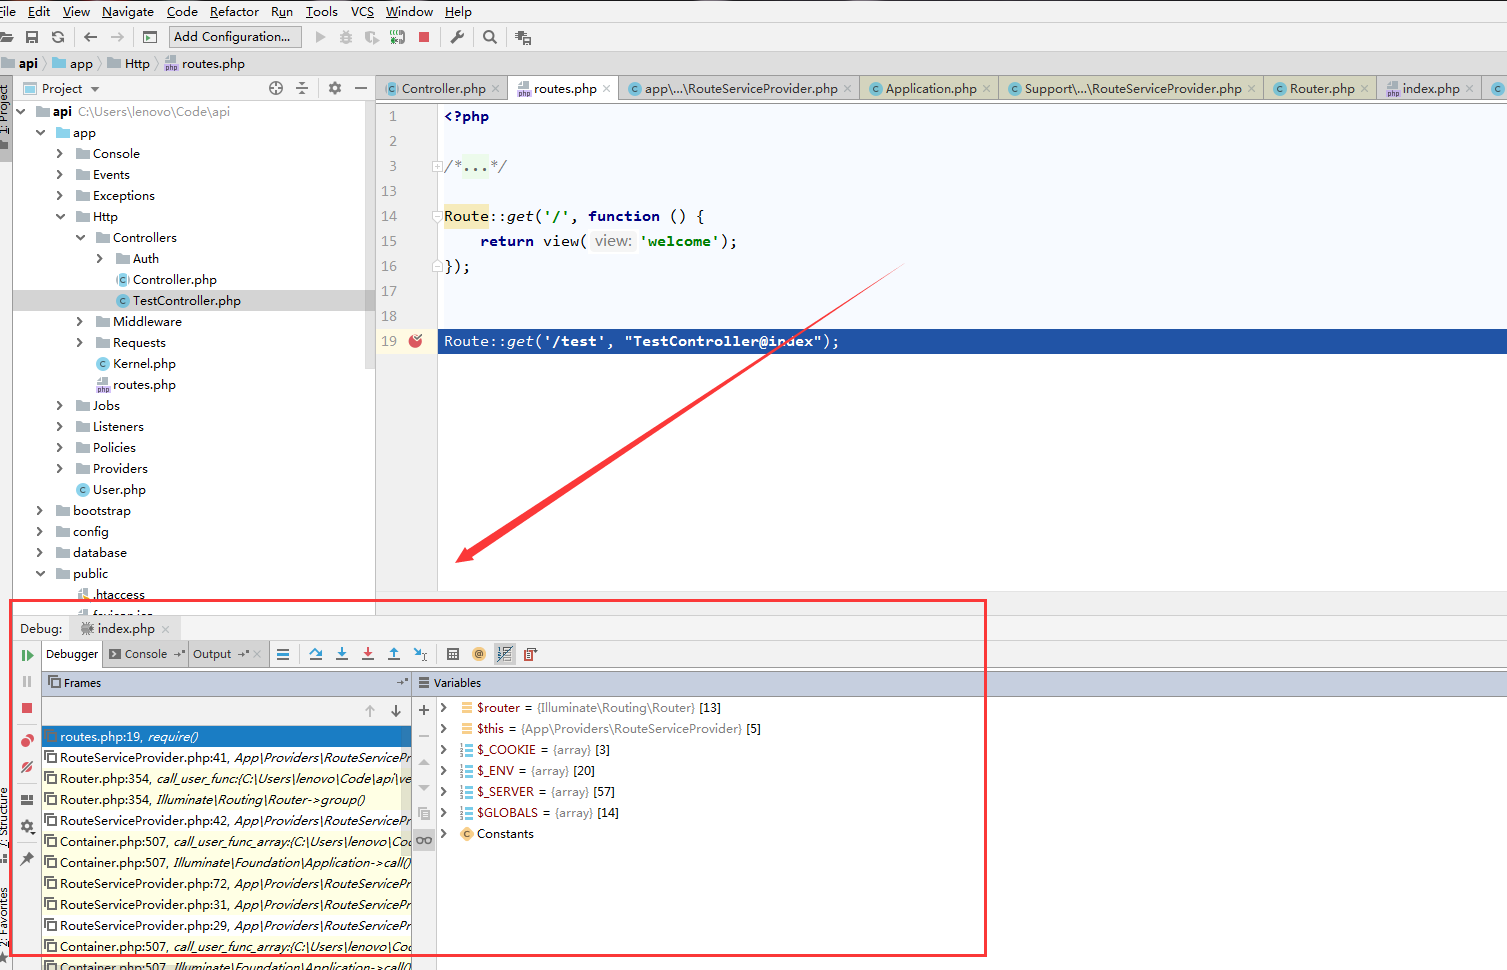
在phpstorm中将需要调试的代码打上断点,点击右上角电话图标开启调试监听,由一头绿一头红变成两头绿即可
4. 开始debug
在谷歌浏览器中输入配置好的Url,会出现如下图所示,恭喜你phpstorm和xdebug的配置基本完成,这时候就可以愉快的进行调试了