###################################

一:合并绘图:
plot(X1,Y1,LineSpec1,...,Xn,Yn,LineSpecn)
x = linspace(-2*pi,2*pi,200);
y1 = sin(x);
y2 = cos(x);

plot(x,y1,'-k',x,y2,'--k');

%标题:
title('Plot');

%坐标
xlabel('x');
ylabel('cos(x)    sin(x)');

%图例
legend('y=sin(x)','y=cos(x)')
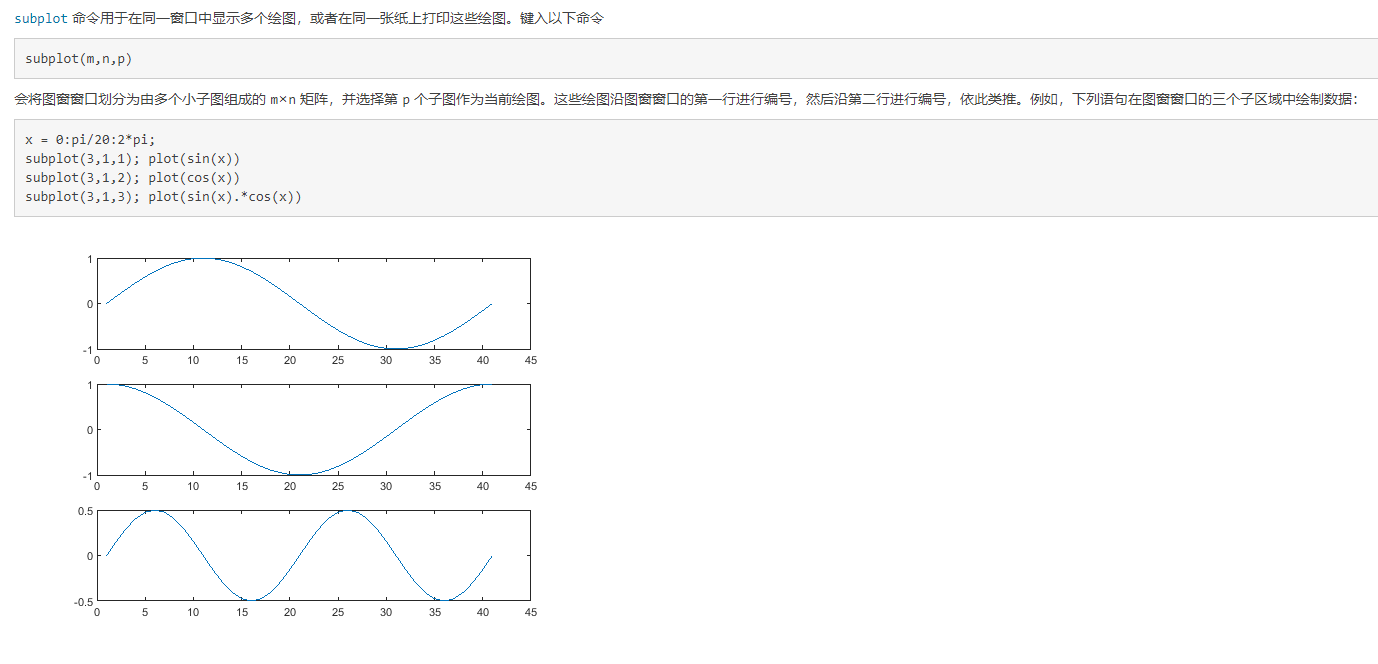
二:子图:subplot(m,n,p)表示整个图一共有m行,每行放n个图片,从左到右从上到下的第p个图片:
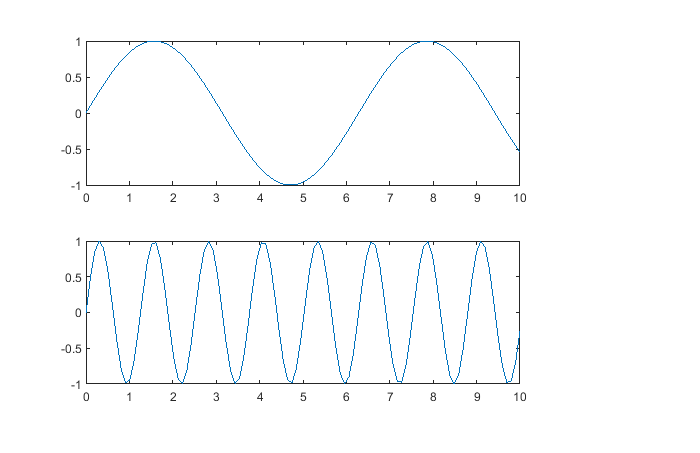
上下两个图:
subplot(2,1,1);
x = linspace(0,10);
y1 = sin(x);
plot(x,y1)

subplot(2,1,2);
y2 = sin(5*x);
plot(x,y2)
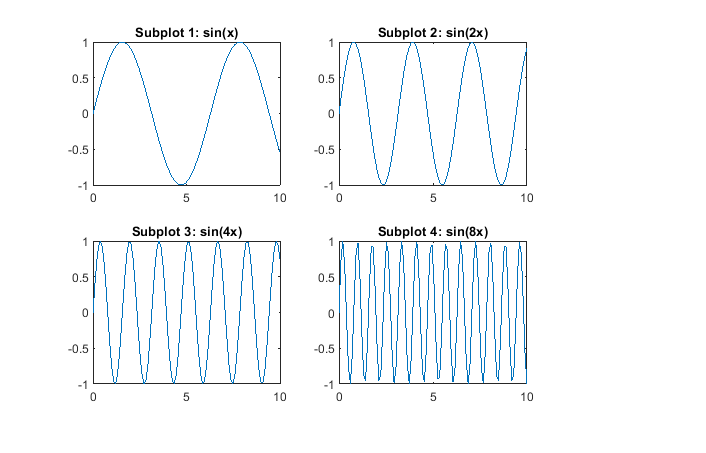
四个图:
subplot(2,2,1)
x = linspace(0,10);
y1 = sin(x);
plot(x,y1)
title('Subplot 1: sin(x)')

subplot(2,2,2)
y2 = sin(2*x);
plot(x,y2)
title('Subplot 2: sin(2x)')

subplot(2,2,3)
y3 = sin(4*x);
plot(x,y3)
title('Subplot 3: sin(4x)')

subplot(2,2,4)
y4 = sin(8*x);
plot(x,y4)
title('Subplot 4: sin(8x)')
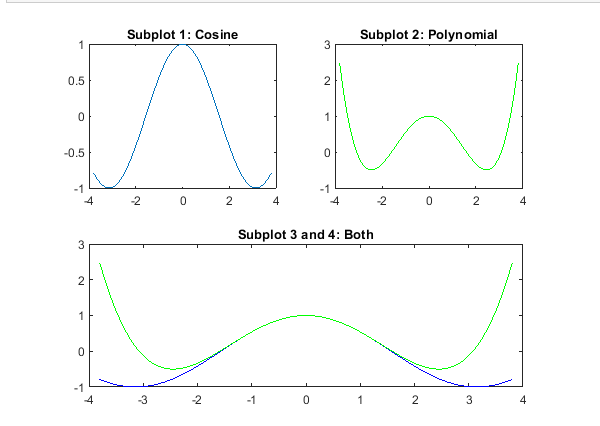
三个图:
创建一个包含三个子图的图窗。在图窗的上半部分创建两个子图,并在图窗的下半部分创建第三个子图。在每个子图上添加标题。

subplot(2,2,1);
x = linspace(-3.8,3.8);
y_cos = cos(x);
plot(x,y_cos);
title('Subplot 1: Cosine')

subplot(2,2,2);
y_poly = 1 - x.^2./2 + x.^4./24;
plot(x,y_poly,'g');
title('Subplot 2: Polynomial')

subplot(2,2,[3,4]);
plot(x,y_cos,'b',x,y_poly,'g');
title('Subplot 3 and 4: Both')
三个图:
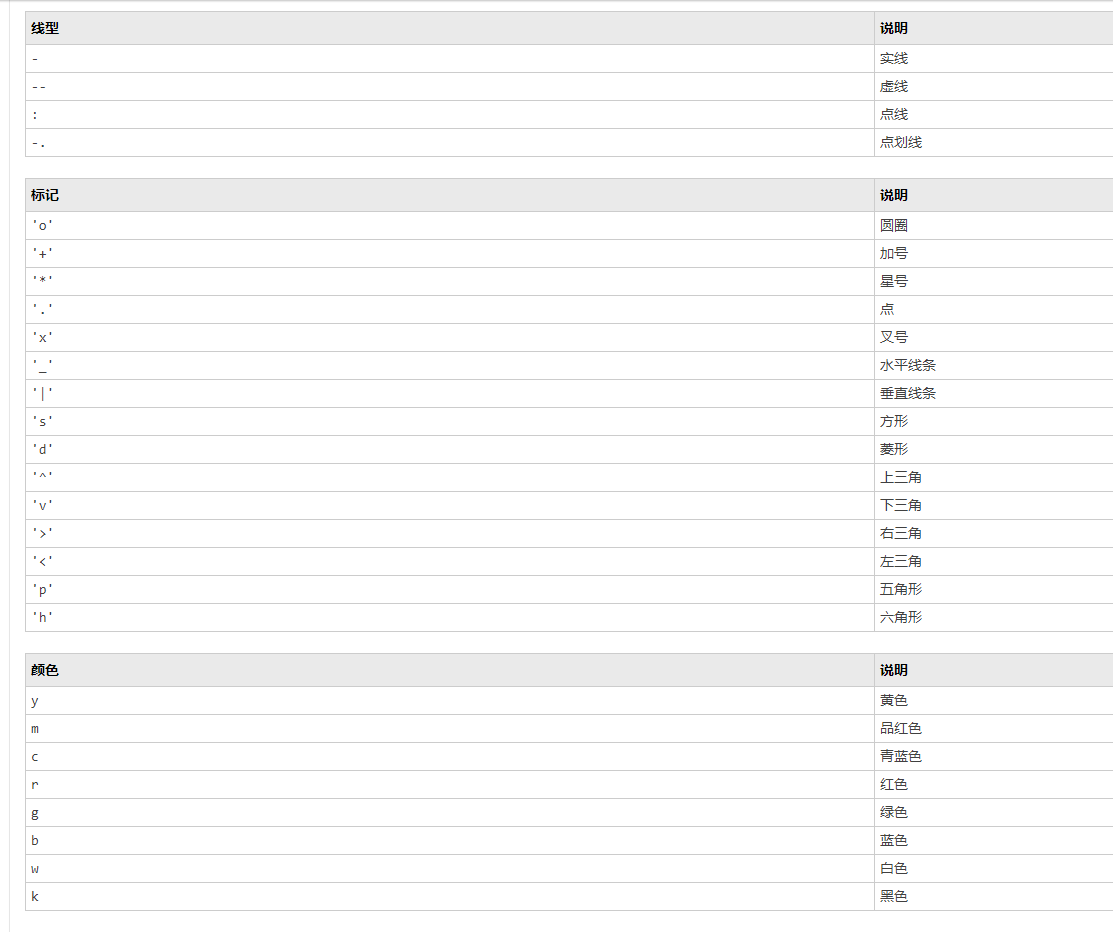
图像修饰:线型标记颜色:
##############################