ECharts的使用与总结
一,介绍与需求
1.1,介绍
ECharts商业级数据图表,一个纯Javascript的图表库,可以流畅的运行在PC和移动设备上,兼容当前绝大部分浏览器(IE6/7/8/9/10/11,chrome,firefox,Safari等),底层依赖轻量级的Canvas类库ZRender,提供直观,生动,可交互,可高度个性化定制的数据可视化图表。创新的拖拽重计算、数据视图、值域漫游等特性大大增强了用户体验,赋予了用户对数据进行挖掘、整合的能力。
支持折线图(区域图)、柱状图(条状图)、散点图(气泡图)、K线图、饼图(环形图)、雷达图(填充雷达图)、和弦图、力导向布局图、地图、仪表盘、漏斗图、事件河流图等12类图表,同时提供标题,详情气泡、图例、值域、数据区域、时间轴、工具箱等7个可交互组件,支持多图表、组件的联动和混搭展现
1.2,需求
可视化展示数据
二,常规使用
以常规饼图为例
第一步:获取 ECharts
1 cnpm install echarts --save
第二步:按需引入 ECharts
1 // 引入 ECharts 主模块
2 var echarts = require('echarts/lib/echarts');
3 // 引入饼图
4 require('echarts/lib/chart/pie');
5 // 引入提示框和标题组件
6 require('echarts/lib/component/tooltip');
7 require('echarts/lib/component/title');
第三步:图表的容器
必须设置宽高(width,height),否则没有效果
1 <div id='main' style={{ '100%', height: 360 }}></div>
第四步:绘制图表
配置数据选项:
1 var option={
2                             title:{},//图表的标题
3                             tooltip:{},//应用的组件
4                             legend:{},//图例组件包括颜色、朝向、位置等
5                             xAxis:[{}],//直角坐标系中x轴需要配置的
6                             yAxis:[{}],//直角坐标系中y轴需要配置的
7                             series:[{}],//系列列表,包括列表类型、颜色、数据等
8             }
图表的绘制:
  1 let chartDate= [{
  2             value: 3661,
  3             name: '三角函数的图象与性质'
  4         }, {
  5             value: 5713,
  6             name: '空间向量及其运算'
  7         },
  8         {
  9             value: 4563,
 10             name: '直线与圆锥曲线的位置关系'
 11         }, {
 12             value: 9938,
 13             name: '复数代数形式的四则运算'
 14         }, {
 15             value: 17623,
 16             name: '集合'
 17         }, {
 18             value: 3299,
 19             name: '公式的联系'
 20         }]
 21 var mainPieChart = eCharts.init(document.getElementById('main'));
 22         // 绘制图表
 23         mainPieChart .setOption({
 24             backgroundColor: '#fff',
 25             title: {
 26                 text: '三角函数',
 27                 x: 'center',
 28                 y: '38%',
 29                 textStyle: {
 30                     fontWeight: 'bold',
 31                     fontSize: 16
 32                 }
 33             },
 34             tooltip: {
 35                 show: true,
 36                 trigger: 'item',
 37                 formatter: "{b}: {c} ({d}%)"
 38             },
 39             legend: {
 40                 orient: 'horizontal',
 41                 top: '74%',
 42                 // data: ['<10w', '10w-50w', '50w-100w', '100w-500w', '>500w']
 43                 data: [{
 44                     name: '三角函数的图象与性质',
 45                     // 强制设置图形为圆。
 46                     icon: 'circle',
 47                 },
 48                 {
 49                     name:  '空间向量及其运算',
 50                     // 强制设置图形为圆。
 51                     icon: 'circle',
 52                 },
 53                 {
 54                     name:  '直线与圆锥曲线的位置关系',
 55                     // 强制设置图形为圆。
 56                     icon: 'circle',
 57                 },
 58                 {
 59                     name:'复数代数形式的四则运算',
 60                     // 强制设置图形为圆。
 61                     icon: 'circle',
 62                 },
 63                 {
 64                     name: '集合',
 65                     // 强制设置图形为圆。
 66                     icon: 'circle',
 67                 },
 68                 {
 69                     name: '公式的联系',
 70                     // 强制设置图形为圆。
 71                     icon: 'circle',
 72                 }],
 73             },
 74             series: [{
 75                 type: 'pie',
 76                 selectedMode: 'single',
 77                 zlevel:1,
 78                 center:['50%', '40%'],//饼图的中心(圆心)坐标,数组的第一项是横坐标,第二项是纵坐标。
 79                 radius: ['36%', '58%'],
 80                 color: ['#86D560', '#AF89D6', '#59ADF3', '#FF999A', '#FFCC67'],
 81                 symbolOffset: [0, 120],
 82                 label: {
 83                     normal: {
 84                         position: 'outside',
 85                         formatter: '{d}%',
 86                         textStyle: {
 87                             color: '#999999',
 88                             fontWeight: 'bold',
 89                             fontSize: 14
 90                         }
 91                     },
 92                     emphasis: {
 93                         color: '#57B3FE',
 94                     }
 95                 },
 96                 labelLine: {
 97                     normal: {
 98                         show: false
 99                     }
100                 },
101                 data: chartDate
102             }]
103         });
选中第一个高亮
1  mainPieChart.dispatchAction({
2                 type: 'highlight',          //高亮指定的数据图形。通过seriesName或者seriesIndex指定系列。如果要再指定某个数据可以再指定dataIndex或者name。
3                 seriesIndex: 0,  // 可选,系列 index,可以是一个数组指定多个系列
4                 dataIndex: 0,          // 可选,数据的 index
5             });
效果如下:

三,特殊使用
3.1,多类图切换保存
工具栏toolbox
1   toolbox: {//工具栏配置  默认不显示
2                 feature : {
3                     dataView : {show: true, readOnly: false},//数据类型
4                     magicType : {show: true, type: ['line', 'bar']},//图标类型切换
5                     restore : {show: true},//还原
6                     saveAsImage : {show: true}//保存图片
7                 },
8 },
渐变色配置:
使用graphic.LinearGradient接口配置渐变色
1  color:new eCharts.graphic.LinearGradient(0, 0, 0, 1, [{
2                                 offset: 0,
3                                 color: '#FFCFCF'
4                             }, {
5                                 offset: 1,
6                                 color: '#F05353'
7                             }]),
绘制图表完整配置:
 1 main.setOption({
 2             title: {
 3                 text: '个人总分较班级/年级',
 4                 left: 'center',
 5             },
 6             legend: {
 7                 top: 30,
 8                 right: 120,
 9                 bottom: 30,
10                 data: ['我', '年级', '班级']
11             },
12             toolbox: {
13
14                 feature : {
15                     dataView : {show: true, readOnly: false},
16                     magicType : {show: true, type: ['line', 'bar']},
17                     restore : {show: true},
18                     saveAsImage : {show: true}
19                 },
20
21             },
22             calculable: true,
23             tooltip: {
24                 formatter: function (params) {
25                     return params.name + "<br/>" + '分数: ' + params.value;
26                 }
27             },
28             xAxis: [
29                 {
30                     type : 'category',
31                     data: ['最高分', '最低分', '平均分']
32                 }
33             ],
34             yAxis: [
35                 {
36                     type: 'value'
37                 }
38             ],
39             series: [
40                 {
41                     name: '我',
42                     type: 'bar',
43                     barWidth: '10%',
44                     itemStyle: {
45                         normal: {
46                             show: true,
47                             color:
48                             new eCharts.graphic.LinearGradient(0, 0, 0, 1, [{
49                                 offset: 0,
50                                 color: '#FFCFCF'
51                             }, {
52                                 offset: 1,
53                                 color: '#F05353'
54                             }]),
55                         }
56                     },
57                     data: [2.0, 4.9, 7.0],
58                 },
59                 {
60                     name: '年级',
61                     type: 'bar',
62                     barWidth: '10%',
63                     itemStyle: {
64                         normal: {
65                             show: true,
66                             color:
67                             new eCharts.graphic.LinearGradient(0, 0, 0, 1, [{
68                                 offset: 0,
69                                 color: '#1FE5BA'
70                             }, {
71                                 offset: 1,
72                                 color: '#18D0CE'
73                             }]),
74                         }
75                     },
76                     data: [2.6, 5.9, 9.0],
77
78                 },
79                 {
80                     name: '班级',
81                     type: 'bar',
82                     barWidth: '10%',
83                     itemStyle: {
84                         normal: {
85                             show: true,
86                             color:
87                              new eCharts.graphic.LinearGradient(0, 0, 0, 1, [{
88                                 offset: 0,
89                                 color: '#909DD4'
90                             }, {
91                                 offset: 1,
92                                 color: '#9E88D3'
93                             }]),
94                         }
95                     },
96                     data: [2.6, 5.9, 9.0],
97                 }
98             ]
99         });
效果:
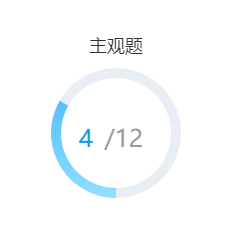
3.2,进度图
graphic 是原生图形元素组件。
 1  graphic: [{
 2                 type: 'text',
 3                 left: '42%',
 4                 top: '48%',
 5                 style: {
 6                     text: '4',
 7                     fill: '#08A0E2',
 8                     fontSize: 24
 9                 }
10             }, {
11                 type: 'text',
12                 left: '46%',
13                 top: '48%',
14                 style: {
15                     text: ' /12',
16                     fill: '#999',
17                     fontSize: 24
18                 }
19             }],
clockWise: true,//饼图的扇区是否是顺时针排布。默认是false
startAngle:270,//起始角度,支持范围[0, 360]。默认为0
绘制图表完整配置:
 1 main.setOption({
 2             backgroundColor: '#fff',
 3             title: {
 4                 text: '主观题',
 5                 left: 'center',
 6                 textStyle: {
 7                     color: '#333333',
 8                     fontWeight: 'normal'
 9                 },
10                 // subtextStyle: {
11                 //     color: '#57B3FE'
12                 // }
13             },
14             graphic: [{
15                 type: 'text',
16                 left: '42%',
17                 top: '48%',
18                 style: {
19                     text: '4',
20                     fill: '#08A0E2',
21                     fontSize: 24
22                 }
23             }, {
24                 type: 'text',
25                 left: '46%',
26                 top: '48%',
27                 style: {
28                     text: ' /12',
29                     fill: '#999',
30                     fontSize: 24
31                 }
32             }],
33             series: [
34                 {
35                     name: "",
36                     type: "pie",
37                     clockWise: true,//饼图的扇区是否是顺时针排布。
38                     startAngle:270,//起始角度,支持范围[0, 360]。
39                     radius: [55, 65],
40                     itemStyle: {
41                         normal: {
42                             label: {
43                                 show: false
44                             },
45                             labelLine: {
46                                 show: false
47                             },
48                         }
49                     },
50                     hoverAnimation: false,
51                     center: ['50%', '50%'],
52                     label: {
53                         normal: {
54                             show: false,
55                             position: "center"
56                         }
57                     },
58                     data: [{
59                         value: 4,
60                         name: "",
61                         label: {
62                             normal: {
63                                 show: false
64                             }
65                         },
66                         itemStyle: {
67                             normal: {
68                                 color:colorValue,
69                             }
70                         }
71                     },
72                     {
73                         value: 8,
74                         name: "",
75                         label: {
76                             normal: {
77                                 show: false
78                             }
79                         },
80                         itemStyle: {
81                             normal: {
82                                 color: "#E9EDF5"
83                             }
84                         }
85                     }
86                     ]
87                 }
88             ]
89         })
效果:
3.3,交互柱状图
鼠标事件包括 'click'、'dblclick'、'mousedown'、'mousemove'、'mouseup'、'mouseover'、'mouseout'、'globalout'、'contextmenu'。
组件交互的行为事件,主要通过 on 方法添加事件处理函数:
 1  main.on('click', setOptionAction);//点击选中 显示对应的name并高亮
 2         main.on('mouseover',setOptionAction);//鼠标移入选中 显示对应的name并高亮
 3         function setOptionAction(params) {
 4             main.setOption({
 5                 title: {
 6                     subtext: params.name,
 7                 },
 8                 series: [
 9                     {
10                         itemStyle: {
11                             normal: {
12                                  color: function (param){
13                                   return (params.value==chartData[param.dataIndex])?
14                                     '#57B3FE':
15                                     new eCharts.graphic.LinearGradient(
16                                 0, 0, 0, 1,
17                                 [
18                                     { offset: 0, color: '#909DD4' },
19                                     { offset: 1, color: '#9E88D3' }
20                                 ]
21                             );
22                               },
23                             },
24                         },
25                     }
26                 ]
27             });
28         }
label字数太多时,显示点点,如下
 1  axisLabel: {
 2                         formatter: function (value) {
 3                             var ret = "";//拼接加
返回的类目项
 4                             var maxLength = 6;//每项显示文字个数
 5                             var valLength = value.length;//X轴类目项的文字个数
 6                             var rowN = Math.ceil(valLength / maxLength); //类目项需要换行的行数
 7                             if (rowN > 1)//如果类目项的文字大于3,
 8                             {
 9                                 var temp = "";//每次截取的字符串
10                                 var start = 0;//开始截取的位置
11                                 var end = maxLength;//结束截取的位置
12                                 //这里也可以加一个是否是最后一行的判断,但是不加也没有影响,那就不加吧
13                                 temp = value.substring(start, end) + "......";
14                                 ret += temp; //凭借最终的字符串
15                                 return ret;
16                             }
17                             else {
18                                 return value;
19                             }
20                         }
21                     }
效果:
3.4,怀特图
echarts没有直接画怀特图的配置,实现思路:创建两个坐标轴,隐藏两个X轴,去掉Y轴线,保留一个刻度。
完整配置如下:
  1  let yAxisMonth = ["NL-3A s1 t1 s1 t1 s3",
  2         "FE-5A",
  3         "FE-3AC",
  4         "GX6",
  5         "FE-S1",
  6         "FE-7A",
  7         "KC-1B",
  8         "KC-2HB(15TD)",
  9         "KC-2(15TD)",
 10         "FE-7",
 11         "FE-3AD",
 12         "KC-2HB",
 13         "FE-4KACK-2",
 14         "NL-3",
 15         "FE-6"
 16     ];
 17     let barData = [
 18         84,
 19         78,
 20         45,
 21         40,
 22         33,
 23         7,
 24         100,
 25         5,
 26         89,
 27         76,
 28         42,
 29         16,
 30         11,
 31         5,
 32         4
 33
 34     ];
 35 let selectValue= 100,
 36  let ShowPosition= 'KC-1B',
 37 main.setOption({
 38             // backgroundColor: "#020e25",
 39             title: {
 40                 text: Charttitle,
 41                 left: 'center',
 42             },
 43             legend: null,
 44             tooltip: {
 45                 trigger: 'axis',
 46                 axisPointer: {
 47                     type: 'line',  // 默认为直线,可选为:'line' | 'shadow'
 48                     lineStyle: {          // 直线指示器样式设置
 49                         color: '#48b',
 50                          2,
 51                         type: 'solid',
 52                         shadowOffsetX: -160,
 53                         shadowColor: '#48b'
 54                     },
 55                 },
 56                 formatter: function (params) {
 57                     return params[0].name + "<br/>" + '百分比: ' + params[0].value + '%';
 58                 }
 59             },
 60             grid: {
 61                 containLabel: true,
 62                 left: "2%",
 63                 right: "10%",
 64                 top: "10%",
 65                 bottom: "5%",
 66             },
 67             yAxis: [{
 68                 data: yAxisMonth,
 69                 inverse: true,
 70                 boundaryGap: true, // 类目起始和结束两端空白策略
 71                 axisLine: {
 72                     show: true,
 73                     onZero: true,
 74                     lineStyle: {        // 属性lineStyle控制线条样式
 75                         color: '#CFCFCF',
 76                          0,
 77                         type: 'solid',
 78                     }
 79                 },
 80                 axisTick: {
 81                     show: false,
 82                     length: 8,
 83                     alignWithLabel: true,
 84                 },
 85                 axisLabel: {
 86                     margin: 60,
 87                     textStyle: {
 88                         fontSize: 12,
 89                         color: '#777777',
 90                     },
 91                 },
 92             },
 93             {
 94                 type: 'category',
 95                 silent: true,
 96                 position: 'left',// 文字位置
 97                 boundaryGap: true, // 类目起始和结束两端空白策略
 98                 offset: 1,
 99                 data: [0, 0.2, 0.4, 0.6, 0.8, 1, 1.2, 1.4, 1.6, 1.8, 2.0, 2.2, 2.40, 2.60, 2.8, 3],
100                 inverse: false,
101                 axisLine: {
102                     lineStyle: {        // 属性lineStyle控制线条样式
103                         color: '#CFCFCF',
104                          0,
105                         type: 'solid',
106                     },
107                     show: true,
108                 },
109                 axisTick: {
110                     alignWithLabel: true,
111                     length: 12,
112                     // secondTick: {
113                     //     show: true,//是否显示二级刻度
114                     //     interval: 0,//二级刻度间间隔大小
115                     //     length: 12,//二级刻度线的长度
116                     //     lineStyle: { //刻度线的线条样式
117                     //         color: 'red',
118                     //          12,
119                     //         type: 'solid',
120                     //     }
121                     // }
122                     // lineStyle: {        // 属性lineStyle控制线条样式
123                     //     color: '#CFCFCF',
124                     //      6,
125                     //     type: 'solid',
126                     // },
127                 },
128                 axisPointer: {
129                     show: false,
130                 },
131                 axisLabel: {
132                     margin: 20,
133                      56,
134                     textStyle: {
135                         fontSize: 12,
136                         color: '#333333',
137                     },
138                     shadowOffsetX: -4,
139                     shadowColor: '#CFCFCF',
140                 },
141                 splitLine: {
142                     show:true,
143                     // interval:0,
144                     lineStyle: {
145                         color: '#fff',
146                         shadowOffsetX:-8,
147                         shadowColor:'#CFCFCF',
148                     }
149                 },
150
151             },
152             ],
153
154             xAxis: [{
155                 type: "value",
156                 splitLine: {
157                     show: false
158                 },
159                 axisLabel: {
160                     show: false
161                 },
162                 axisTick: {
163                     show: false
164                 },
165                 axisPointer: {
166                     show: false,
167                 },
168                 axisLine: {
169                     show: false
170                 }
171             },
172             {
173                 type: "value",
174                 splitLine: {
175                     show: false
176                 },
177                 axisLabel: {
178                     show: false
179                 },
180                 axisTick: {
181                     show: false
182                 },
183                 axisPointer: {
184                     show: false,
185                 },
186                 axisLine: {
187                     show: false
188                 }
189             },
190             ],
191             series: [{
192                 z: 10,
193                 type: 'pictorialBar',
194                 label: {
195                     normal: {
196                         show: true,
197                         formatter: function (param) {
198                             return (selectValue == param.value) ? '' : param.value + '%';
199                         },
200                         position: 'right',// 文字位置
201                         textStyle: {
202                             fontSize: 12,
203                             color: '#666666',
204                         }
205                     }
206                 },
207                 symbolRepeat: false,
208                 symbolSize: ['100%', 10],// 柱子大小
209                 symbolOffset: [10, 0],
210                 itemStyle: {
211                     normal: {
212                         color: '#FF8E71',
213                     },
214                     emphasis: {
215                         color: '#1790FF',
216                     }
217                 },
218                 symbolClip: true,
219                 symbolPosition: 'end',
220                 symbol: 'rect',
221                 markPoint: {
222                     symbolSize: 32,
223                     symbolOffset: [10, 0],//偏移量
224                     symbolRotate: 270,//旋转
225                     itemStyle: {
226                         normal: {
227                             borderColor: '#1790FF',
228                             borderWidth: 2, // 标注边线线宽,单位px,默认为1
229                             color: '#fff',
230                             label: {
231                                 position: 'insideRight',
232                                 fontSize: 12,
233                                 color: '#1790FF'
234                             }
235                         },
236                     },
237                     normal: {
238                         label: {
239                             position: 'insideRight',
240                         }
241                     },
242                     data: [
243                         { name: '最高', value: '我', xAxis: selectValue, yAxis: ShowPosition },//通过yAxis来控制markPoint的位置
244                         { name: '我', value: '我', xAxis: selectValue, yAxis: ShowPosition },
245                     ]
246                 },
247                 data: barData,
248             },
249             ]
250         });
251         main.dispatchAction({
252             type: 'highlight',          //高亮指定的数据图形。通过seriesName或者seriesIndex指定系列。如果要再指定某个数据可以再指定dataIndex或者name。
253             dataIndex: 6,          // 可选,数据的 index
254         });
效果:

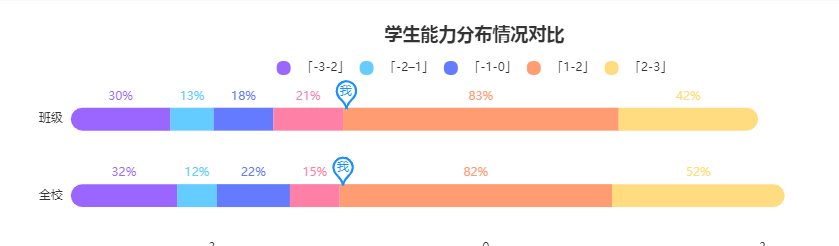
3.5,堆叠图
stack数据堆叠,同个类目轴上系列配置相同的stack值可以堆叠放置。
 1  {
 2                     name: '「-3-2」',
 3                     type: 'bar',
 4                     barWidth: '30%',
 5                     stack: '总量',
 6                     color:'#9B65FF',
 7                     label: {
 8                         normal: {
 9                             show: true,
10                             formatter: function (param) {
11                                 return param.value + '%';
12                             },
13                             position: 'top'
14                         }
15                     },
16                     itemStyle: {
17                         normal: {
18                             barBorderRadius: [12, 0, 0,12]
19                         },
20                     },
21                     data: [32, 30]
22                 }
markPoint:图表标注。详细点击查看
效果: