zoukankan      html  css  js  c++  java
  • ASP.NET Core 3.1 配合 ECharts 做简单 Dashboard 自我实践

    简单的网页应用项目,客户提供了简单的Dashboard数据展示需求;

    对于那些 PowerBI那些专业数据钻取、统计、分析展示平台,这个客户的需求真的算是很简单了;

    但是 难者不会 会者不难... 只好赶鸭子上架 去找 网页 柱状图、饼图等控件来学习;

    无意中,找到了 ECharts ,真的发现极其非常适合本人的开发需求,简单、轻量、以及不错的自定义和扩展性;

    https://echarts.apache.org/zh/index.html

    写个随笔记录下自己研究的过程,主要是结合自己的开发工具及开发环境;

    开发工具: VS2019 开发环境: .net core 3.1 采用MVC架构;

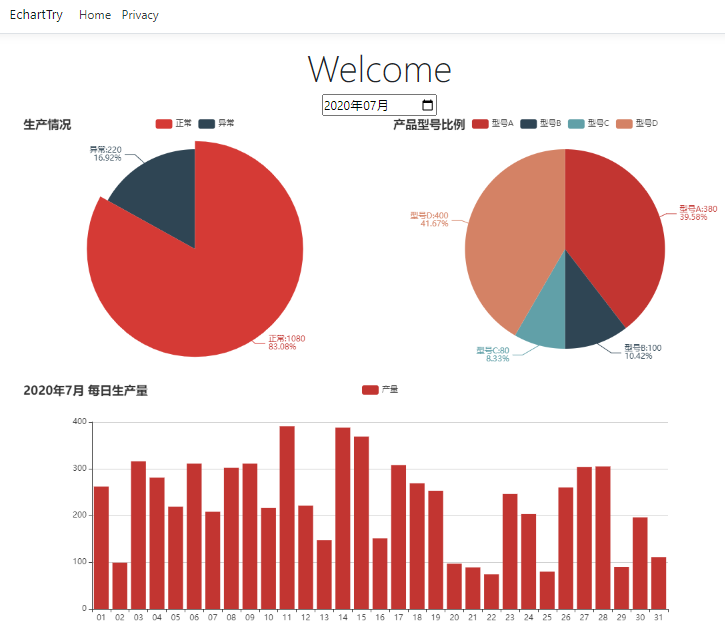
    实现目标:网页显示 饼图、柱状图 ,动态从后台调取数据到前台来展示。

    虽然我知道 Echarts 实际上是JS 轻量级图表解决方案,最合适的应该不是.net core mvc来搭配...

    但是不是一个项目赶到这了... 项目是 .net core mvc 做的,再去换java 时间精力也不够了... 就一条道走到黑吧... 


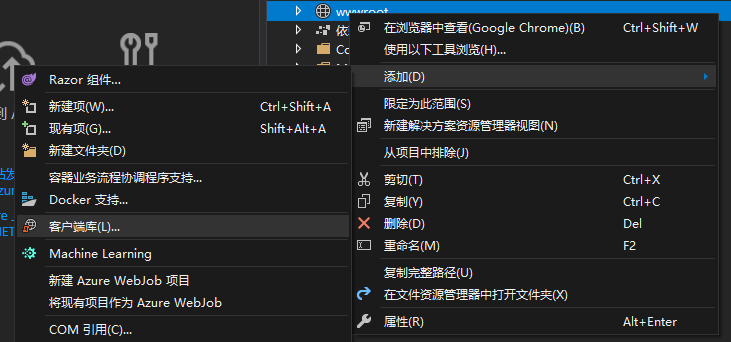
    在VS2019中安装Echarts不是在NuGet里, 而是右键点击 wwwroot 再选择添加 -> 客户端库
     输入 echarts 会出现最新的 @4.8.0版本,下面的文件就先全选上吧...然后点 安装

    在_Layout.cshtml 视图的head段,加入js :

    <!DOCTYPE html>
    <html lang="en">
    <head>
        <meta charset="utf-8" />
        <meta name="viewport" content="width=device-width, initial-scale=1.0" />
        <title>@ViewData["Title"] - EchartTry</title>
        <link rel="stylesheet" href="~/lib/bootstrap/dist/css/bootstrap.min.css" />
        <link rel="stylesheet" href="~/css/site.css" />
        <script src="~/echarts/echarts.min.js"></script>
    </head>

    然后把Home对应的视图改成: 

    @{
        ViewData["Title"] = "Home Page";
    }
    
        <div class="text-center">
            <h1 class="display-4">Welcome</h1>
            <div class="container">
                <div class="row">
                    <div class="col" id="left" style=" 400px;height:400px;">
    
                    </div>
                    <div class="col" id="right" style=" 400px;height:400px;">
    
                    </div>
                </div>
                <div class="row">
                    <div class="col" id="bottom" style=" 800px;height:400px;">
    
                    </div>
                </div>
            </div>
            <script type="text/javascript">
                var myleftChart = echarts.init(document.getElementById('left'));
                var myrightChart = echarts.init(document.getElementById('right'));
                var mybottomChart = echarts.init(document.getElementById('bottom'));
    
                var leftoption = {
                    title: {
                        text: '生产情况'
                    },
                    legend: {
                        data: ['正常','异常']
                    },
                    series: [{
                        type: 'pie',
                        data: [{ name: '正常', value: 1080 }, { name: '异常', value: 220 }],
                        label:
                        {
                            formatter: '{b}:{c}
    {d}%'
                        }
                    }]
                };
    
                var rightoption = {
                    title: {
                        text: '产品型号比例'
                    },
                    legend: {
                        data: ['型号A', '型号B', '型号C', '型号D']
                    },
                    series: [{
                        type: 'pie',
                        data: [{ name: '型号A', value: 380 },
                            { name: '型号B', value: 100 },
                            { name: '型号C', value: 80 },
                            { name: '型号D', value: 400 }],
                        label:
                        {
                            formatter: '{b}:{c}
    {d}%'
                        }
                    }]
                };
    
                var bottomoption = {
                    title: {
                        text: 'ECharts 入门示例'
                    },
                    tooltip: {},
                    legend: {
                        data: ['销量']
                    },
                    xAxis: {
                        data: ["衬衫", "羊毛衫", "雪纺衫", "裤子", "高跟鞋", "袜子"]
                    },
                    yAxis: {},
                    series: [{
                        name: '销量',
                        type: 'bar',
                        data: [5, 20, 36, 10, 10, 20]
                    }]
                };
    
                myleftChart.setOption(leftoption);
                myrightChart.setOption(rightoption);
                mybottomChart.setOption(bottomoption);
            </script>
        </div>

    跑起来看看:
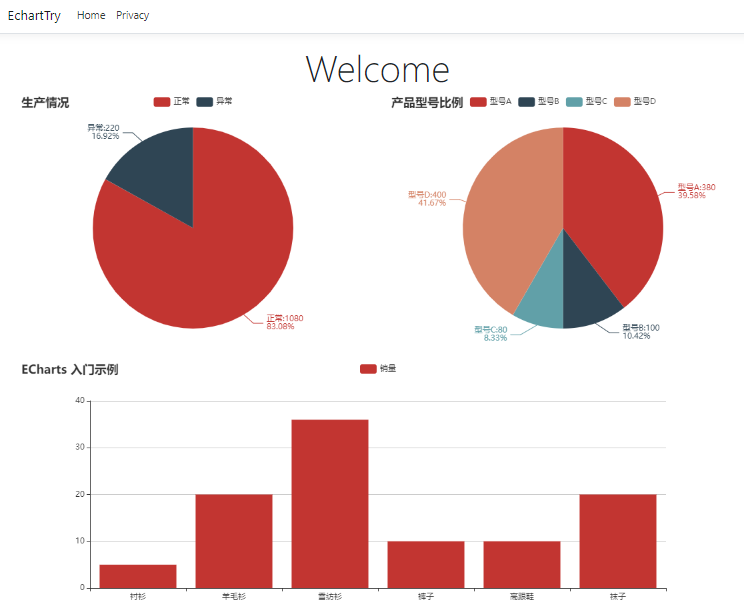
     哈,像那么回事。。。

    下面要继续的研究工作:

    1、一些需要的特殊显示要求的实现;

    2、如何从后台动态调数据到前台;

    3、第2个项目调数据时 需要ajax方式;

    初步考虑思路:

    1、增加一个WEB API 提供数据;

    2、视图中通过ajax 调WEB API获取数据后,刷新图表;

    3、先做 柱状图 ,以月份为输入条件,然后横坐标显示月份内的每一天的生产产量;

    第一步,先定义一个模型

        public class SummaryData
        {
            public string title { get; set; }
            public string[] categories { get; set; }
            public int[] data { get; set; }
        }

    第二步:加一个WEB API控制器,就用默认名字 ValuesController

     就通过日期来模拟出一个月的产量数据(用随机数代替...正常的应该是去数据库取数据)

         [HttpGet]
            public ActionResult<SummaryData> Get()
            {
                return GetMonthlyData(null);
            }
    
            [HttpGet("{id}")]
            public ActionResult<SummaryData> Get(DateTime id)
            {                       
                return GetMonthlyData(id);
            }
    
            private SummaryData GetMonthlyData(DateTime? month)
            {
                var newData = new SummaryData();
                DateTime chartMonth;
                if (month == null)
                {
                    chartMonth = DateTime.Today;
                }
                else
                {
                    chartMonth = (DateTime)month;
                }
                newData.title = chartMonth.Year + "" + chartMonth.Month + "月 每日生产量";
                int days = DateTime.DaysInMonth(chartMonth.Year, chartMonth.Month);
                newData.categories = new string[days];
                newData.data = new int[days];
                for (int i = 1; i <= days; i++)
                {
                    newData.categories[i - 1] = i.ToString().PadLeft(2, '0');
                    newData.data[i - 1] = GetRandomNumber(50, 400);
                }
                return newData;
            }
            private int GetRandomNumber(int min, int max)
            {
                int rtn = 0;
                Random r = new Random();
                byte[] buffer = Guid.NewGuid().ToByteArray();
                int iSeed = BitConverter.ToInt32(buffer, 0);
                r = new Random(iSeed);
                rtn = r.Next(min, max + 1);
                return rtn;
            }

    Home视图改下:

    @{
        ViewData["Title"] = "Home Page";
    }
    
        <div class="text-center">
            <h1 class="display-4">Welcome</h1>
            <div class="container">
                <div>
                    <input type="month" id="inputdate" onchange="refresh(this.value)" value="@ViewData["SearchDate"]"  />          
                </div>
                <div class="row">
                    <div class="col" id="left" style=" 800px;height:400px;">
    
                    </div>
                    <div class="col" id="right" style=" 800px;height:400px;">
    
                    </div>
                </div>
                <div class="row">
                    <div class="col" id="bottom" style=" 1600px;height:400px;">
    
                    </div>
                </div>
            </div>
            <script type="text/javascript">
                var myleftChart = echarts.init(document.getElementById('left'));
                var myrightChart = echarts.init(document.getElementById('right'));
                var mybottomChart = echarts.init(document.getElementById('bottom'));
                var leftoption = {
                    title: {
                        text: '生产情况'
                    },
                    legend: {
                        data: ['正常','异常']
                    },
                    series: [{
                        type: 'pie',
                        data: [{ name: '正常', value: 1080 }, { name: '异常', value: 220 }],
                        label:
                        {
                            formatter: '{b}:{c}
    {d}%'
                        }
                    }]
                };
                var rightoption = {
                    title: {
                        text: '产品型号比例'
                    },
                    legend: {
                        data: ['型号A', '型号B', '型号C', '型号D']
                    },
                    series: [{
                        type: 'pie',
                        data: [{ name: '型号A', value: 380 },
                            { name: '型号B', value: 100 },
                            { name: '型号C', value: 80 },
                            { name: '型号D', value: 400 }],
                        label:
                        {
                            formatter: '{b}:{c}
    {d}%'
                        }
                    }]
                };
    
                var bottomoption = {
                    title: {
                        text: ''
                    },
                    tooltip: {},
                    legend: {
                        data: ['']
                    },
                    xAxis: {
                        data: []
                    },
                    yAxis: {},
                    series: [{
                        name: '',
                        type: 'bar',
                        data: []
                    }]
                };
    
                myleftChart.setOption(leftoption);
                myrightChart.setOption(rightoption);
                mybottomChart.setOption(bottomoption);
    
                window.onload = function () {
                    $.ajax({
                        url: "/api/values/",
                        type: "get",
                        dataType: "json",
                        success: function (data) {
                            mybottomChart.hideLoading();
                            mybottomChart.setOption({
                                title: {
                                    text: data.title
                                },
                                legend: {
                                    data: ['产量']
                                },
                                xAxis: {
                                    data: data.categories
                                },
                                yAxis: {},
                                series: [{
                                    // 根据名字对应到相应的系列
                                    name: '产量',
                                    data: data.data
                                }]
                            });
                        }
                    });
                }           
    
                function refresh(month) {
                    mybottomChart.showLoading();
                    $.ajax({
                        url: "/api/values/" + month,
                        type: "get",
                        dataType: "json",
                        success: function (data) {
                            mybottomChart.hideLoading();
                            mybottomChart.setOption({
                                title: {
                                    text: data.title
                                },
                                legend: {
                                    data: ['产量']
                                },
                                xAxis: {
                                    data: data.categories
                                },
                                yAxis: {},
                                series: [{
                                    // 根据名字对应到相应的系列
                                    name: '产量',
                                    data: data.data
                                }]
                            });
                        }
                    });
                };            
            </script>
        </div>

    Run起来看看效果:
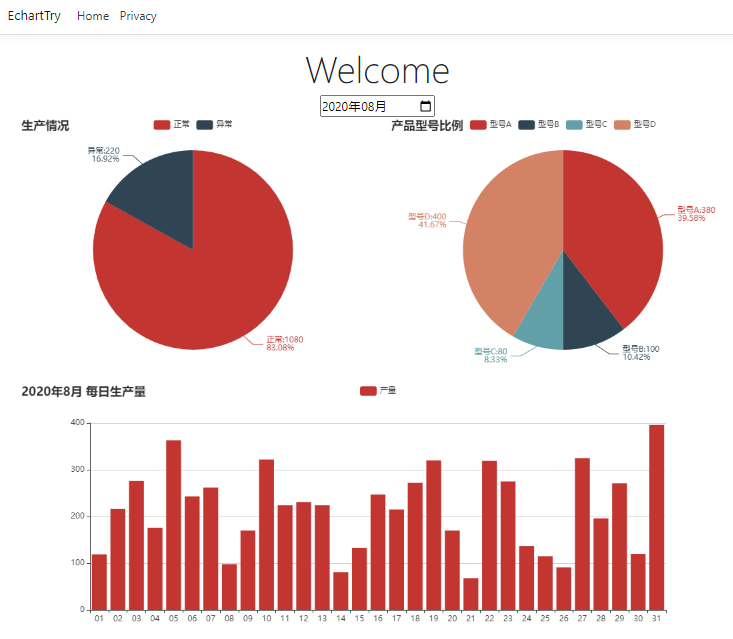
    下一步:在月度每日的柱状图上点击后,再显示一个当日的分时柱状图; 

    在Home视图增加一个Div 放入 月柱状图的下面:

                <div class="row">
                    <div class="col" id="bottom" style=" 1600px;height:400px;">
    
                    </div>
                </div>
                <div class="row">
                    <div class="col" id="dailybar" style=" 1600px;height:400px;">
    
                    </div>
                </div>        

    然后在JS语句后面继续增加以下代码:

    var mydailybarChart = echarts.init(document.getElementById('dailybar'));
    
    var dailybaroption = {
                    title: {
                        text: ''
                    },
                    tooltip: {},
                    legend: {
                        data: ['']
                    },
                    xAxis: {
                        data: []
                    },
                    yAxis: {},
                    series: [{
                        name: '',
                        type: 'bar',
                        data: []
                    }]
                };
    
    mydailybarChart.setOption(dailybaroption);
    
    mybottomChart.on('click', function (params) {
                    mydailybarChart.showLoading();
                    $.ajax({
                        url: "/api/DailyDatas/" + inputdate.value + "?selectindex=" + params.dataIndex,
                        type: "get",
                        dataType: "json",
                        success: function (data) {
                            mydailybarChart.hideLoading();
                            mydailybarChart.setOption({
                                title: {
                                    text: data.title
                                },
                                legend: {
                                    data: ['产量']
                                },
                                xAxis: {
                                    data: data.categories
                                },
                                yAxis: {},
                                series: [{
                                    // 根据名字对应到相应的系列
                                    name: '产量',
                                    data: data.data
                                }]
                            });
                        }
                    });
                });

    增加一个DailyDatas 的WEB API控制器:

       public class DailyDatasController : ControllerBase
        {
    
            [HttpGet("{id}")]
            public ActionResult<SummaryData> Get(string id, [FromQuery] int selectindex)
            {
                DateTime dt_Select = DateTime.Parse(id + "-" + (selectindex + 1) + " 00:00:00");
    
                return GetDailyData(dt_Select);
            }
            private SummaryData GetDailyData(DateTime day)
            {
                var newData = new SummaryData();           
                newData.title = day.ToString("yyyy-MM-dd") + " 小时生产量";
                
                newData.categories = new string[10];
                newData.data = new int[10];
                for (int i = 8; i <= 17; i++)
                {
                    newData.categories[i - 8] = i.ToString().PadLeft(2, '0') + ":00";
                    newData.data[i - 8] = GetRandomNumber(10, 50);
                }
                return newData;
            }
    
            private int GetRandomNumber(int min, int max)
            {
                int rtn = 0;
                Random r = new Random();
                byte[] buffer = Guid.NewGuid().ToByteArray();
                int iSeed = BitConverter.ToInt32(buffer, 0);
                r = new Random(iSeed);
                rtn = r.Next(min, max + 1);
                return rtn;
            }
        }
  • 相关阅读:
    Visifire正式版(v1.1)发布
    [转]PSP机能强大!已能模拟运行WINDOWS系统?
    在Silverlight+WCF中应用以角色为基础的安全模式(一)基础篇之角色为基础的安全模式简介 Virus
    C#的加密解密算法,包括Silverlight的MD5算法 Virus
    MMORPG programming in Silverlight Tutorial (10)Implement the sprite’s 2D animation (Part IV)
    Game Script: Rescue Bill Gates
    MMORPG programming in Silverlight Tutorial (9)KeyFrame Animation
    MMORPG programming in Silverlight Tutorial (5)Implement the sprite’s 2D animation (Part II)
    MMORPG programming in Silverlight Tutorial (7)Perfect animation
    MMORPG programming in Silverlight Tutorial (3)Animate the object (Part III)
  • 原文地址:https://www.cnblogs.com/jacky-zhang/p/13446542.html
Copyright © 2011-2022 走看看