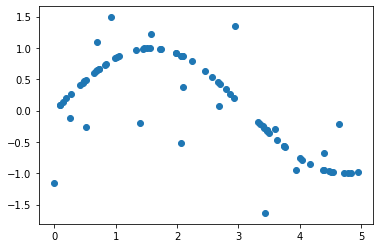
# 先构造正弦函数 + 噪音
import numpy as np

rng = np.random.RandomState(1)
X = np.sort(5 * rng.rand(80, 1), axis=0)  # 生成 0~5之间随机数据,并排序,因为 sklearn用二维特征数据,所以定义数据时候直接定义为二维
y = np.sin(X).ravel()  # 对数据进行降维,sklearn标签数据是一维的
y[::5] += 3 * (0.5 - rng.rand(16))  # 添加噪音
# 画出图像
import matplotlib.pyplot as plt

plt.scatter(X, y)
<matplotlib.collections.PathCollection at 0x24fda557b08>

# 训练两个不同深度的回归模型
from sklearn.tree import DecisionTreeRegressor

regr1 = DecisionTreeRegressor(max_depth=2)
regr2 = DecisionTreeRegressor(max_depth=10)
regr1.fit(X, y)
regr2.fit(X, y)
DecisionTreeRegressor(criterion='mse', max_depth=10, max_features=None,
                      max_leaf_nodes=None, min_impurity_decrease=0.0,
                      min_impurity_split=None, min_samples_leaf=1,
                      min_samples_split=2, min_weight_fraction_leaf=0.0,
                      presort=False, random_state=None, splitter='best')
# 构建测试数据集
X_test = np.arange(0, 5.0, 0.01)[:, np.newaxis]  # 数据转换为 二维
y_1 = regr1.predict(X_test)
y_2 = regr2.predict(X_test)
# 画出两个模型拟合的图像
plt.figure(num='title1', figsize=(16, 4))
plt.scatter(X_test, y_1, c='red')
plt.title('y1', size=15)
plt.xlabel('x', size=15)
plt.ylabel('y', size=15)

plt.figure(num='title2', figsize=(16, 4))
plt.scatter(X_test, y_2, c='green')
plt.title('y2', size=15)
plt.xlabel('x', size=15)
plt.ylabel('y', size=15)
Text(0, 0.5, 'y')


