十三种基于直方图的图像全局二值化算法原理、实现、代码及效果(转) 图像二值化的目的是最大限度的将图象中感兴趣的部分保留下来,在很多情况下,也是进行图像分析、特征提取与模式识别之前的必要的图像预处理过程。这个看似简单的问题,在过去的四十年里受到国内外学者的广泛关注,产生了数以百计的阈值选取方法,但如同其他图像分割算法一样,没有一个现有方法对各种各样的图像都能得到令人满意的结果。
在这些庞大的分类方法中,基于直方图的全局二值算法占有了绝对的市场份额,这些算法都从不同的科学层次提出了各自的实施方案,并且这类方法都有着一些共同的特点:
1、简单;
2、算法容易实现;
3、执行速度快。
本文摘取了若干种这类方法进行了介绍。
一:灰度平局值值法:
1、描述:即使用整幅图像的灰度平均值作为二值化的阈值,一般该方法可作为其他方法的初始猜想值。
2、原理:
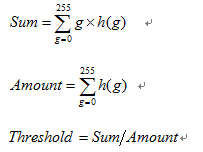
3、实现代码:
 public static int GetMeanThreshold(int[] HistGram)
    {
        int Sum = 0, Amount = 0;
        for (int Y = 0; Y < 256; Y++)
        {
            Amount += HistGram[Y];
            Sum += Y * HistGram[Y];
        }
        return Sum / Amount;
} 二、百分比阈值(P-Tile法)
1、描述
Doyle于1962年提出的P-Tile (即P分位数法)可以说是最古老的一种阈值选取方法。该方法根据先验概率来设定阈值,使得二值化后的目标或背景像素比例等于先验概率,该方法简单高效,但是对于先验概率难于估计的图像却无能为力。
2、该原理比较简单,直接以代码实现。
    /// <summary>
    /// 百分比阈值
    /// </summary>
    /// <param name="HistGram">灰度图像的直方图</param>
    /// <param name="Tile">背景在图像中所占的面积百分比</param>
    /// <returns></returns>
    public static int GetPTileThreshold(int[] HistGram, int Tile = 50)
    {
        int Y, Amount = 0, Sum = 0;
        for (Y = 0; Y < 256; Y++) Amount += HistGram[Y];        //  像素总数
         for (Y = 0; Y < 256; Y++)
        {
            Sum = Sum + HistGram[Y];
            if (Sum >= Amount * Tile / 100) return Y;
        }
        return -1;
    }
三、基于谷底最小值的阈值
1、描述:
此方法实用于具有明显双峰直方图的图像,其寻找双峰的谷底作为阈值,但是该方法不一定能获得阈值,对于那些具有平坦的直方图或单峰图像,该方法不合适。
2、实现过程:
该函数的实现是一个迭代的过程,每次处理前对直方图数据进行判断,看其是否已经是一个双峰的直方图,如果不是,则对直方图数据进行半径为1(窗口大小为3)的平滑,如果迭代了一定的数量比如1000次后仍未获得一个双峰的直方图,则函数执行失败,如成功获得,则最终阈值取两个双峰之间的谷底值作为阈值。
注意在编码过程中,平滑的处理需要当前像素之前的信息,因此需要对平滑前的数据进行一个备份。另外,首数据类型精度限制,不应用整形的直方图数据,必须转换为浮点类型数据来进行处理,否则得不到正确的结果。
该算法相关参考论文如下:
J. M. S. Prewitt and M. L. Mendelsohn, "The analysis of cell images," innnals of the New York Academy of Sciences, vol. 128, pp. 1035-1053, 1966.
C. A. Glasbey, "An analysis of histogram-based thresholding algorithms," CVGIP: Graphical Models and Image Processing, vol. 55, pp. 532-537, 1993.
3、实现代码:
    public static int GetMinimumThreshold(int[] HistGram)
    {
        int Y, Iter = 0;
        double[] HistGramC = new double[256];           // 基于精度问题,一定要用浮点数来处理,否则得不到正确的结果
        double[] HistGramCC = new double[256];          // 求均值的过程会破坏前面的数据,因此需要两份数据
        for (Y = 0; Y < 256; Y++)
        {
            HistGramC[Y] = HistGram[Y];
            HistGramCC[Y] = HistGram[Y];
        }

        // 通过三点求均值来平滑直方图
        while (IsDimodal(HistGramCC) == false)                                        // 判断是否已经是双峰的图像了
        {
            HistGramCC[0] = (HistGramC[0] + HistGramC[0] + HistGramC[1]) / 3;                 // 第一点
            for (Y = 1; Y < 255; Y++)
                HistGramCC[Y] = (HistGramC[Y - 1] + HistGramC[Y] + HistGramC[Y + 1]) / 3;     // 中间的点
            HistGramCC[255] = (HistGramC[254] + HistGramC[255] + HistGramC[255]) / 3;         // 最后一点
            System.Buffer.BlockCopy(HistGramCC, 0, HistGramC, 0, 256 * sizeof(double));
            Iter++;
            if (Iter >= 1000) return -1;                                                   // 直方图无法平滑为双峰的,返回错误代码
        }
       // 阈值极为两峰之间的最小值
        bool Peakfound = false;
        for (Y = 1; Y < 255; Y++)
        {
            if (HistGramCC[Y - 1] < HistGramCC[Y] && HistGramCC[Y + 1] < HistGramCC[Y]) Peakfound = true;
            if (Peakfound == true && HistGramCC[Y - 1] >= HistGramCC[Y] && HistGramCC[Y + 1] >= HistGramCC[Y])
                return Y - 1;
        }
        return -1;
    }
其中IsDimodal函数为判断直方图是否是双峰的函数,代码如下:
    private static bool IsDimodal(double[] HistGram)       // 检测直方图是否为双峰的
    {
        // 对直方图的峰进行计数,只有峰数位2才为双峰
        int Count = 0;
        for (int Y = 1; Y < 255; Y++)
        {
            if (HistGram[Y - 1] < HistGram[Y] && HistGram[Y + 1] < HistGram[Y])
            {
                Count++;
                if (Count > 2) return false;
            }
        }
        if (Count == 2)
            return true;
        else
            return false;
    }
4、效果:


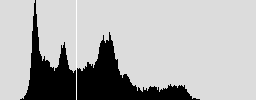

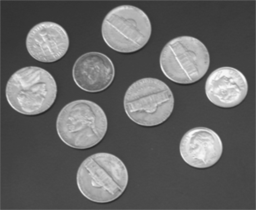


原图 二值图 原始直方图 平滑后的直方图
对于这种有较明显的双峰的图像,该算法还是能取得不错的效果的。
四、基于双峰平均值的阈值
1、描述:
该算法和基于谷底最小值的阈值方法类似,只是最后一步不是取得双峰之间的谷底值,而是取双峰的平均值作为阈值。
2、参考代码:
 public static int GetIntermodesThreshold(int[] HistGram)
    {
        int Y, Iter = 0, Index;
        double[] HistGramC = new double[256];           // 基于精度问题,一定要用浮点数来处理,否则得不到正确的结果
        double[] HistGramCC = new double[256];          // 求均值的过程会破坏前面的数据,因此需要两份数据
        for (Y = 0; Y < 256; Y++)
        {
            HistGramC[Y] = HistGram[Y];
            HistGramCC[Y] = HistGram[Y];
        }
        // 通过三点求均值来平滑直方图
        while (IsDimodal(HistGramCC) == false)                                                  // 判断是否已经是双峰的图像了
        {
            HistGramCC[0] = (HistGramC[0] + HistGramC[0] + HistGramC[1]) / 3;                   // 第一点
            for (Y = 1; Y < 255; Y++)
                HistGramCC[Y] = (HistGramC[Y - 1] + HistGramC[Y] + HistGramC[Y + 1]) / 3;       // 中间的点
            HistGramCC[255] = (HistGramC[254] + HistGramC[255] + HistGramC[255]) / 3;           // 最后一点
            System.Buffer.BlockCopy(HistGramCC, 0, HistGramC, 0, 256 * sizeof(double));         // 备份数据,为下一次迭代做准备
            Iter++;
            if (Iter >= 10000) return -1;                                                       // 似乎直方图无法平滑为双峰的,返回错误代码
        }
// 阈值为两峰值的平均值
        int[] Peak = new int[2];
        for (Y = 1, Index = 0; Y < 255; Y++)
            if (HistGramCC[Y - 1] < HistGramCC[Y] && HistGramCC[Y + 1] < HistGramCC[Y]) Peak[Index++] = Y - 1;
        return ((Peak[0] + Peak[1]) / 2);
    }
3、效果:


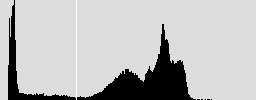

原图 二值图 原始直方图 平滑后的直方图
五、迭代最佳阈值
1、描述:
该算法先假定一个阈值,然后计算在该阈值下的前景和背景的中心值,当前景和背景中心值得平均值和假定的阈值相同时,则迭代中止,并以此值为阈值进行二值化。
2、实现过程:
(1)求出图象的最大灰度值和最小灰度值,分别记为gl和gu,令初始阈值为:

(2) 根据阈值T0将图象分割为前景和背景,分别求出两者的平均灰度值Ab和Af:
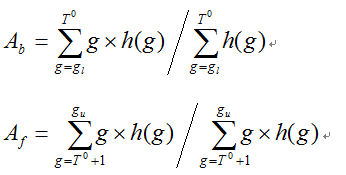
(3) 令

如果Tk=Tk+1,则取Tk为所求得的阈值,否则,转2继续迭代。
3、参考代码:
    public static int GetIterativeBestThreshold(int[] HistGram)
    {
        int X, Iter = 0;
        int MeanValueOne, MeanValueTwo, SumOne, SumTwo, SumIntegralOne, SumIntegralTwo;
        int MinValue, MaxValue;
        int Threshold, NewThreshold;

        for (MinValue = 0; MinValue < 256 && HistGram[MinValue] == 0; MinValue++) ;
        for (MaxValue = 255; MaxValue > MinValue && HistGram[MinValue] == 0; MaxValue--) ;

        if (MaxValue == MinValue) return MaxValue;          // 图像中只有一个颜色
        if (MinValue + 1 == MaxValue) return MinValue;      // 图像中只有二个颜色

        Threshold = MinValue;
        NewThreshold = (MaxValue + MinValue) >> 1;
        while (Threshold != NewThreshold)    // 当前后两次迭代的获得阈值相同时,结束迭代
        {
            SumOne = 0; SumIntegralOne = 0;
            SumTwo = 0; SumIntegralTwo = 0;
            Threshold = NewThreshold;
            for (X = MinValue; X <= Threshold; X++)         //根据阈值将图像分割成目标和背景两部分,求出两部分的平均灰度值
            {
                SumIntegralOne += HistGram[X] * X;
                SumOne += HistGram[X];
            }
            MeanValueOne = SumIntegralOne / SumOne;
            for (X = Threshold + 1; X <= MaxValue; X++)
            {
                SumIntegralTwo += HistGram[X] * X;
                SumTwo += HistGram[X];
            }
            MeanValueTwo = SumIntegralTwo / SumTwo;
            NewThreshold = (MeanValueOne + MeanValueTwo) >> 1;       //求出新的阈值
            Iter++;
            if (Iter >= 1000) return -1;
        }
        return Threshold;
    }
4、效果:
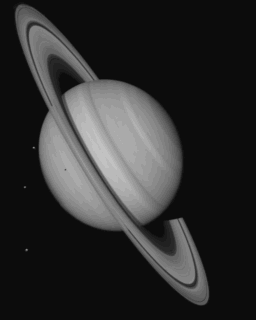


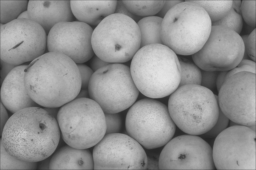


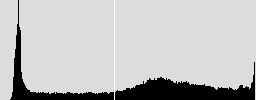
原图 二值图 直方图
六、OSTU大律法
1、描述:
该算法是1979年由日本大津提出的,主要是思想是取某个阈值,使得前景和背景两类的类间方差最大,matlab中的graythresh即是以该算法为原理执行的。
2、原理:
关于该算法的原理,网络上有很多,这里为了篇幅有限,不加以赘述。
3、参考代码:
    public static int GetOSTUThreshold(int[] HistGram)
    {
        int X, Y, Amount = 0;
        int PixelBack = 0, PixelFore = 0, PixelIntegralBack = 0, PixelIntegralFore = 0, PixelIntegral = 0;
        double OmegaBack, OmegaFore, MicroBack, MicroFore, SigmaB, Sigma;              // 类间方差;
        int MinValue, MaxValue;
        int Threshold = 0;

        for (MinValue = 0; MinValue < 256 && HistGram[MinValue] == 0; MinValue++) ;
        for (MaxValue = 255; MaxValue > MinValue && HistGram[MinValue] == 0; MaxValue--) ;
        if (MaxValue == MinValue) return MaxValue;          // 图像中只有一个颜色
        if (MinValue + 1 == MaxValue) return MinValue;      // 图像中只有二个颜色

        for (Y = MinValue; Y <= MaxValue; Y++) Amount += HistGram[Y];        //  像素总数

        PixelIntegral = 0;
        for (Y = MinValue; Y <= MaxValue; Y++) PixelIntegral += HistGram[Y] * Y;
        SigmaB = -1;
        for (Y = MinValue; Y < MaxValue; Y++)
        {
            PixelBack = PixelBack + HistGram[Y];
            PixelFore = Amount - PixelBack;
            OmegaBack = (double)PixelBack / Amount;
            OmegaFore = (double)PixelFore / Amount;
            PixelIntegralBack += HistGram[Y] * Y;
            PixelIntegralFore = PixelIntegral - PixelIntegralBack;
            MicroBack = (double)PixelIntegralBack / PixelBack;
            MicroFore = (double)PixelIntegralFore / PixelFore;
            Sigma = OmegaBack * OmegaFore * (MicroBack - MicroFore) * (MicroBack - MicroFore);
            if (Sigma > SigmaB)
            {
                SigmaB = Sigma;
                Threshold = Y;
            }
        }
        return Threshold;
    }
4、效果:


该算法对于那些具有平坦的直方图的图像具有一定的适应能力。
七、一维最大熵
1、描述:
该算法把信息论中熵的概念引入到图像中,通过计算阈值分割后两部分熵的和来判断阈值是否为最佳阈值。
2、算法原理
这方面的文章也比较多,留给读者自行去查找相关资料。
3、参考代码:
public static int Get1DMaxEntropyThreshold(int[] HistGram)
    {
        int  X, Y,Amount=0;
        double[] HistGramD = new double[256];
        double SumIntegral, EntropyBack, EntropyFore, MaxEntropy;
        int MinValue = 255, MaxValue = 0;
        int Threshold = 0;

        for (MinValue = 0; MinValue < 256 && HistGram[MinValue] == 0; MinValue++) ;
        for (MaxValue = 255; MaxValue > MinValue && HistGram[MinValue] == 0; MaxValue--) ;
        if (MaxValue == MinValue) return MaxValue;          // 图像中只有一个颜色
        if (MinValue + 1 == MaxValue) return MinValue;      // 图像中只有二个颜色

        for (Y = MinValue; Y <= MaxValue; Y++) Amount += HistGram[Y];        //  像素总数

        for (Y = MinValue; Y <= MaxValue; Y++)   HistGramD[Y] = (double)HistGram[Y] / Amount+1e-17;

        MaxEntropy = double.MinValue; ;
        for (Y = MinValue + 1; Y < MaxValue; Y++)
        {
            SumIntegral = 0;
            for (X = MinValue; X <= Y; X++) SumIntegral += HistGramD[X];
            EntropyBack = 0;
            for (X = MinValue; X <= Y; X++) EntropyBack += (-HistGramD[X] / SumIntegral * Math.Log(HistGramD[X] / SumIntegral));
            EntropyFore = 0;
            for (X = Y + 1; X <= MaxValue; X++) EntropyFore += (-HistGramD[X] / (1 - SumIntegral) * Math.Log(HistGramD[X] / (1 - SumIntegral)));
            if (MaxEntropy < EntropyBack + EntropyFore)
            {
                Threshold = Y;
                MaxEntropy = EntropyBack + EntropyFore;
            }
        }
        return Threshold;
    }
八、力矩保持法
1、描述:
该算法通过选择恰当的阈值从而使得二值后的图像和原始的灰度图像具有三个相同的初始力矩值。
2、原理:
参考论文:W. Tsai, “Moment-preserving thresholding: a new approach,” Comput.Vision Graphics Image Process., vol. 29, pp. 377-393, 1985.
由于无法下载到该论文(收费的),仅仅给出从其他一些资料中找到的公式共享一下。

其中的ABC的函数可见代码部分。
3、参考代码:
public static byte GetMomentPreservingThreshold(int[] HistGram)
    {
        int X, Y, Index = 0, Amount=0;
        double[] Avec = new double[256];
        double X2, X1, X0, Min;

        for (Y = 0; Y <= 255; Y++) Amount += HistGram[Y];        //  像素总数
        for (Y = 0; Y < 256; Y++) Avec[Y] = (double)A(HistGram, Y) / Amount;       // The threshold is chosen such that A(y,t)/A(y,n) is closest to x0.

        // The following finds x0.

        X2 = (double)(B(HistGram, 255) * C(HistGram, 255) - A(HistGram, 255) * D(HistGram, 255)) / (double)(A(HistGram, 255) * C(HistGram, 255) - B(HistGram, 255) * B(HistGram, 255));
        X1 = (double)(B(HistGram, 255) * D(HistGram, 255) - C(HistGram, 255) * C(HistGram, 255)) / (double)(A(HistGram, 255) * C(HistGram, 255) - B(HistGram, 255) * B(HistGram, 255));
        X0 = 0.5 - (B(HistGram, 255) / A(HistGram, 255) + X2 / 2) / Math.Sqrt(X2 * X2 - 4 * X1);

        for (Y = 0, Min = double.MaxValue; Y < 256; Y++)
        {
            if (Math.Abs(Avec[Y] - X0) < Min)
            {
                Min = Math.Abs(Avec[Y] - X0);
                Index = Y;
            }
        }
        return (byte)Index;
    }

    private static double A(int[] HistGram, int Index)
    {
        double Sum = 0;
        for (int Y = 0; Y <= Index; Y++)
            Sum += HistGram[Y];
        return Sum;
    }

    private static double B(int[] HistGram, int Index)
    {
        double Sum = 0;
        for (int Y = 0; Y <= Index; Y++)
            Sum += (double)Y * HistGram[Y];
        return Sum;
    }

    private static double C(int[] HistGram, int Index)
    {
        double Sum = 0;
        for (int Y = 0; Y <= Index; Y++)
            Sum += (double)Y * Y * HistGram[Y];
        return Sum;
    }

    private static double D(int[] HistGram, int Index)
    {
        double Sum = 0;
        for (int Y = 0; Y <= Index; Y++)
            Sum += (double)Y * Y * Y * HistGram[Y];
        return Sum;
    }
对于很多图像,该算法页能取得比较满意的结果。
九、基于模糊集理论的阈值
该算法的具体分析可见:基于模糊集理论的一种图像二值化算法的原理、实现效果及代码
此法也借用香农熵的概念,该算法一般都能获得较为理想的分割效果,不管是对双峰的还是单峰的图像。
十、Kittler最小错误分类法
由于精力有限,以下几种算法仅仅给出算法的论文及相关的代码。
该算法具体的分析见:
- Kittler, J & Illingworth, J (1986), "Minimum error thresholding", Pattern Recognition 19: 41-47
参考代码:
 public static int GetKittlerMinError(int[] HistGram)
    {
        int X, Y;
        int MinValue, MaxValue;
        int Threshold ;
        int PixelBack, PixelFore;
        double OmegaBack, OmegaFore, MinSigma, Sigma, SigmaBack, SigmaFore;
        for (MinValue = 0; MinValue < 256 && HistGram[MinValue] == 0; MinValue++) ;
        for (MaxValue = 255; MaxValue > MinValue && HistGram[MinValue] == 0; MaxValue--) ;
        if (MaxValue == MinValue) return MaxValue;          // 图像中只有一个颜色
        if (MinValue + 1 == MaxValue) return MinValue;      // 图像中只有二个颜色
        Threshold = -1;
        MinSigma = 1E+20;
        for (Y = MinValue; Y < MaxValue; Y++)
        {
            PixelBack = 0; PixelFore = 0;
            OmegaBack = 0; OmegaFore = 0;
            for (X = MinValue; X <= Y; X++)
            {
                PixelBack += HistGram[X];
                OmegaBack = OmegaBack + X * HistGram[X];
            }
            for (X = Y + 1; X <= MaxValue; X++)
            {
                PixelFore += HistGram[X];
                OmegaFore = OmegaFore + X * HistGram[X];
            }
            OmegaBack = OmegaBack / PixelBack;
            OmegaFore = OmegaFore / PixelFore;
            SigmaBack = 0; SigmaFore = 0;
            for (X = MinValue; X <= Y; X++) SigmaBack = SigmaBack + (X - OmegaBack) * (X - OmegaBack) * HistGram[X];
            for (X = Y + 1; X <= MaxValue; X++) SigmaFore = SigmaFore + (X - OmegaFore) * (X - OmegaFore) * HistGram[X];
            if (SigmaBack == 0 || SigmaFore == 0)
            {
                if (Threshold == -1)
                    Threshold = Y;
            }
            else
            {
                SigmaBack = Math.Sqrt(SigmaBack / PixelBack);
                SigmaFore = Math.Sqrt(SigmaFore / PixelFore);
                Sigma = 1 + 2 * (PixelBack * Math.Log(SigmaBack / PixelBack) + PixelFore * Math.Log(SigmaFore / PixelFore));
                if (Sigma < MinSigma)
                {
                    MinSigma = Sigma;
                    Threshold = Y;
                }
            }
        }
        return Threshold;
    }
从实际的运行效果看,该算法并不很好。
十一:ISODATA(也叫做intermeans法)
参考论文:
- Ridler, TW & Calvard, S (1978), "Picture thresholding using an iterative selection method", IEEE Transactions on Systems, Man and Cybernetics 8: 630-632, <http://ieeexplore.ieee.org/xpls/abs_all.jsp?arnumber=4310039>
参考代码(未做整理):
 // Also called intermeans
    // Iterative procedure based on the isodata algorithm [T.W. Ridler, S. Calvard, Picture
    // thresholding using an iterative selection method, IEEE Trans. System, Man and
    // Cybernetics, SMC-8 (1978) 630-632.]
    // The procedure divides the image into objects and background by taking an initial threshold,
    // then the averages of the pixels at or below the threshold and pixels above are computed.
    // The averages of those two values are computed, the threshold is incremented and the
    // process is repeated until the threshold is larger than the composite average. That is,
    //  threshold = (average background + average objects)/2
    // The code in ImageJ that implements this function is the getAutoThreshold() method in the ImageProcessor class.
    //
    // From: Tim Morris (dtm@ap.co.umist.ac.uk)
    // Subject: Re: Thresholding method?
    // posted to sci.image.processing on 1996/06/24
    // The algorithm implemented in NIH Image sets the threshold as that grey
    // value, G, for which the average of the averages of the grey values
    // below and above G is equal to G. It does this by initialising G to the
    // lowest sensible value and iterating:

    // L = the average grey value of pixels with intensities < G
    // H = the average grey value of pixels with intensities > G
    // is G = (L + H)/2?
    // yes => exit
    // no => increment G and repeat
    //
    // There is a discrepancy with IJ because they are slightly different methods

    public static int GetIsoDataThreshold(int[] HistGram)
    {
        int i, l, toth, totl, h, g = 0;
        for (i = 1; i < HistGram.Length; i++)
        {
            if (HistGram[i] > 0)
            {
                g = i + 1;
                break;
            }
        }
        while (true)
        {
            l = 0;
            totl = 0;
            for (i = 0; i < g; i++)
            {
                totl = totl + HistGram[i];
                l = l + (HistGram[i] * i);
            }
            h = 0;
            toth = 0;
            for (i = g + 1; i < HistGram.Length; i++)
            {
                toth += HistGram[i];
                h += (HistGram[i] * i);
            }
            if (totl > 0 && toth > 0)
            {
                l /= totl;
                h /= toth;
                if (g == (int)Math.Round((l + h) / 2.0))
                    break;
            }
            g++;
            if (g > HistGram.Length - 2)
            {
                return 0;
            }
        }
        return g;
} 十二、Shanbhag 法
参考论文:
Shanbhag, Abhijit G. (1994), "Utilization of information measure as a means of image thresholding", Graph. Models Image Process. (Academic Press, Inc.) 56 (5): 414--419, ISSN 1049-9652, DOI 10.1006/cgip.1994.1037
参考代码(未整理):
public static int GetShanbhagThreshold(int[] HistGram)
    {
        int threshold;
        int ih, it;
        int first_bin;
        int last_bin;
        double term;
        double tot_ent;  /* total entropy */
        double min_ent;  /* max entropy */
        double ent_back; /* entropy of the background pixels at a given threshold */
        double ent_obj;  /* entropy of the object pixels at a given threshold */
        double[] norm_histo = new double[HistGram.Length]; /* normalized histogram */
        double[] P1 = new double[HistGram.Length]; /* cumulative normalized histogram */
        double[] P2 = new double[HistGram.Length];

        int total = 0;
        for (ih = 0; ih < HistGram.Length; ih++)
            total += HistGram[ih];

        for (ih = 0; ih < HistGram.Length; ih++)
            norm_histo[ih] = (double)HistGram[ih] / total;

        P1[0] = norm_histo[0];
        P2[0] = 1.0 - P1[0];
        for (ih = 1; ih < HistGram.Length; ih++)
        {
            P1[ih] = P1[ih - 1] + norm_histo[ih];
            P2[ih] = 1.0 - P1[ih];
        }

        /* Determine the first non-zero bin */
        first_bin = 0;
        for (ih = 0; ih < HistGram.Length; ih++)
        {
            if (!(Math.Abs(P1[ih]) < 2.220446049250313E-16))
            {
                first_bin = ih;
                break;
            }
        }

        /* Determine the last non-zero bin */
        last_bin = HistGram.Length - 1;
        for (ih = HistGram.Length - 1; ih >= first_bin; ih--)
        {
            if (!(Math.Abs(P2[ih]) < 2.220446049250313E-16))
            {
                last_bin = ih;
                break;
            }
        }

        // Calculate the total entropy each gray-level
        // and find the threshold that maximizes it
        threshold = -1;
        min_ent = Double.MaxValue;

        for (it = first_bin; it <= last_bin; it++)
        {
            /* Entropy of the background pixels */
            ent_back = 0.0;
            term = 0.5 / P1[it];
            for (ih = 1; ih <= it; ih++)
            { //0+1?
                ent_back -= norm_histo[ih] * Math.Log(1.0 - term * P1[ih - 1]);
            }
            ent_back *= term;

            /* Entropy of the object pixels */
            ent_obj = 0.0;
            term = 0.5 / P2[it];
            for (ih = it + 1; ih < HistGram.Length; ih++)
            {
                ent_obj -= norm_histo[ih] * Math.Log(1.0 - term * P2[ih]);
            }
            ent_obj *= term;

            /* Total entropy */
            tot_ent = Math.Abs(ent_back - ent_obj);

            if (tot_ent < min_ent)
            {
                min_ent = tot_ent;
                threshold = it;
            }
        }
        return threshold;
    }
十三、Yen法
参考论文:
1) Yen J.C., Chang F.J., and Chang S. (1995) "A New Criterion for Automatic Multilevel Thresholding" IEEE Trans. on Image Processing, 4(3): 370-378
2) Sezgin M. and Sankur B. (2004) "Survey over Image Thresholding Techniques and Quantitative Performance Evaluation" Journal of Electronic Imaging, 13(1): 146-165
参考代码(未整理):
 // M. Emre Celebi
    // 06.15.2007
    // Ported to ImageJ plugin by G.Landini from E Celebi's fourier_0.8 routines
    public static int GetYenThreshold(int[] HistGram)
    {
        int threshold;
        int ih, it;
        double crit;
        double max_crit;
        double[] norm_histo = new double[HistGram.Length]; /* normalized histogram */
        double[] P1 = new double[HistGram.Length]; /* cumulative normalized histogram */
        double[] P1_sq = new double[HistGram.Length];
        double[] P2_sq = new double[HistGram.Length];

        int total = 0;
        for (ih = 0; ih < HistGram.Length; ih++)
            total += HistGram[ih];

        for (ih = 0; ih < HistGram.Length; ih++)
            norm_histo[ih] = (double)HistGram[ih] / total;

        P1[0] = norm_histo[0];
        for (ih = 1; ih < HistGram.Length; ih++)
            P1[ih] = P1[ih - 1] + norm_histo[ih];

        P1_sq[0] = norm_histo[0] * norm_histo[0];
        for (ih = 1; ih < HistGram.Length; ih++)
            P1_sq[ih] = P1_sq[ih - 1] + norm_histo[ih] * norm_histo[ih];

        P2_sq[HistGram.Length - 1] = 0.0;
        for (ih = HistGram.Length - 2; ih >= 0; ih--)
            P2_sq[ih] = P2_sq[ih + 1] + norm_histo[ih + 1] * norm_histo[ih + 1];

        /* Find the threshold that maximizes the criterion */
        threshold = -1;
        max_crit = Double.MinValue;
        for (it = 0; it < HistGram.Length; it++)
        {
            crit = -1.0 * ((P1_sq[it] * P2_sq[it]) > 0.0 ? Math.Log(P1_sq[it] * P2_sq[it]) : 0.0) + 2 * ((P1[it] * (1.0 - P1[it])) > 0.0 ? Math.Log(P1[it] * (1.0 - P1[it])) : 0.0);
            if (crit > max_crit)
            {
                max_crit = crit;
                threshold = it;
            }
        }
        return threshold;
} 一行很多代码是摘自开源软件ImageJ的资料,读者也可以参考:http://fiji.sc/wiki/index.php/Auto_Threshold 这里获得更多的信息。
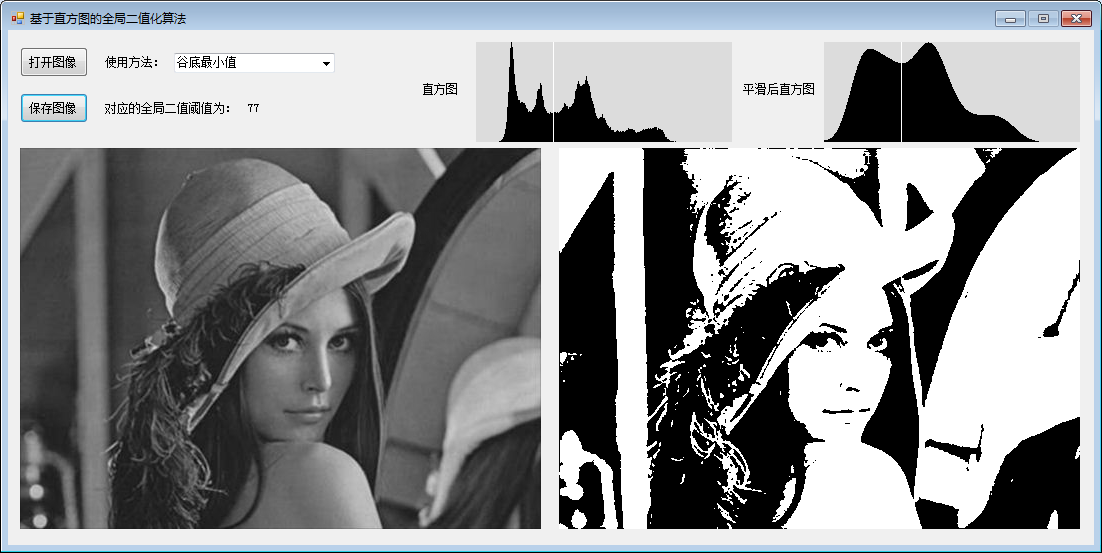
最后,我对这些算法的做了简单的UI界面,供有兴趣的读者参考。
工程代码下载:http://files.cnblogs.com/Imageshop/HistgramBinaryzation.rar
图像二值化的目的是最大限度的将图象中感兴趣的部分保留下来,在很多情况下,也是进行图像分析、特征提取与模式识别之前的必要的图像预处理过程。这个看似简单的问题,在过去的四十年里受到国内外学者的广泛关注,产生了数以百计的阈值选取方法,但如同其他图像分割算法一样,没有一个现有方法对各种各样的图像都能得到令人满意的结果。
在这些庞大的分类方法中,基于直方图的全局二值算法占有了绝对的市场份额,这些算法都从不同的科学层次提出了各自的实施方案,并且这类方法都有着一些共同的特点:
1、简单;
2、算法容易实现;
3、执行速度快。
本文摘取了若干种这类方法进行了介绍。
一:灰度平局值值法:
1、描述:即使用整幅图像的灰度平均值作为二值化的阈值,一般该方法可作为其他方法的初始猜想值。
2、原理:

3、实现代码:
public static int GetMeanThreshold(int[] HistGram)
{
int Sum = 0, Amount = 0;
for (int Y = 0; Y < 256; Y++)
{
Amount += HistGram[Y];
Sum += Y * HistGram[Y];
}
return Sum / Amount;
}二、百分比阈值(P-Tile法)
1、描述
Doyle于1962年提出的P-Tile (即P分位数法)可以说是最古老的一种阈值选取方法。该方法根据先验概率来设定阈值,使得二值化后的目标或背景像素比例等于先验概率,该方法简单高效,但是对于先验概率难于估计的图像却无能为力。
2、该原理比较简单,直接以代码实现。
/// <summary>
/// 百分比阈值
/// </summary>
/// <param name="HistGram">灰度图像的直方图</param>
/// <param name="Tile">背景在图像中所占的面积百分比</param>
/// <returns></returns>
public static int GetPTileThreshold(int[] HistGram, int Tile = 50)
{
int Y, Amount = 0, Sum = 0;
for (Y = 0; Y < 256; Y++) Amount += HistGram[Y]; // 像素总数
for (Y = 0; Y < 256; Y++)
{
Sum = Sum + HistGram[Y];
if (Sum >= Amount * Tile / 100) return Y;
}
return -1;
}三、基于谷底最小值的阈值
1、描述:
此方法实用于具有明显双峰直方图的图像,其寻找双峰的谷底作为阈值,但是该方法不一定能获得阈值,对于那些具有平坦的直方图或单峰图像,该方法不合适。
2、实现过程:
该函数的实现是一个迭代的过程,每次处理前对直方图数据进行判断,看其是否已经是一个双峰的直方图,如果不是,则对直方图数据进行半径为1(窗口大小为3)的平滑,如果迭代了一定的数量比如1000次后仍未获得一个双峰的直方图,则函数执行失败,如成功获得,则最终阈值取两个双峰之间的谷底值作为阈值。
注意在编码过程中,平滑的处理需要当前像素之前的信息,因此需要对平滑前的数据进行一个备份。另外,首数据类型精度限制,不应用整形的直方图数据,必须转换为浮点类型数据来进行处理,否则得不到正确的结果。
该算法相关参考论文如下:
J. M. S. Prewitt and M. L. Mendelsohn, "The analysis of cell images," innnals of the New York Academy of Sciences, vol. 128, pp. 1035-1053, 1966.
C. A. Glasbey, "An analysis of histogram-based thresholding algorithms," CVGIP: Graphical Models and Image Processing, vol. 55, pp. 532-537, 1993.
3、实现代码:
public static int GetMinimumThreshold(int[] HistGram)
{
int Y, Iter = 0;
double[] HistGramC = new double[256]; // 基于精度问题,一定要用浮点数来处理,否则得不到正确的结果
double[] HistGramCC = new double[256]; // 求均值的过程会破坏前面的数据,因此需要两份数据
for (Y = 0; Y < 256; Y++)
{
HistGramC[Y] = HistGram[Y];
HistGramCC[Y] = HistGram[Y];
}
// 通过三点求均值来平滑直方图
while (IsDimodal(HistGramCC) == false) // 判断是否已经是双峰的图像了
{
HistGramCC[0] = (HistGramC[0] + HistGramC[0] + HistGramC[1]) / 3; // 第一点
for (Y = 1; Y < 255; Y++)
HistGramCC[Y] = (HistGramC[Y - 1] + HistGramC[Y] + HistGramC[Y + 1]) / 3; // 中间的点
HistGramCC[255] = (HistGramC[254] + HistGramC[255] + HistGramC[255]) / 3; // 最后一点
System.Buffer.BlockCopy(HistGramCC, 0, HistGramC, 0, 256 * sizeof(double));
Iter++;
if (Iter >= 1000) return -1; // 直方图无法平滑为双峰的,返回错误代码
}
// 阈值极为两峰之间的最小值
bool Peakfound = false;
for (Y = 1; Y < 255; Y++)
{
if (HistGramCC[Y - 1] < HistGramCC[Y] && HistGramCC[Y + 1] < HistGramCC[Y]) Peakfound = true;
if (Peakfound == true && HistGramCC[Y - 1] >= HistGramCC[Y] && HistGramCC[Y + 1] >= HistGramCC[Y])
return Y - 1;
}
return -1;
}
其中IsDimodal函数为判断直方图是否是双峰的函数,代码如下:
private static bool IsDimodal(double[] HistGram) // 检测直方图是否为双峰的
{
// 对直方图的峰进行计数,只有峰数位2才为双峰
int Count = 0;
for (int Y = 1; Y < 255; Y++)
{
if (HistGram[Y - 1] < HistGram[Y] && HistGram[Y + 1] < HistGram[Y])
{
Count++;
if (Count > 2) return false;
}
}
if (Count == 2)
return true;
else
return false;
}
4、效果:


原图 二值图 原始直方图 平滑后的直方图
对于这种有较明显的双峰的图像,该算法还是能取得不错的效果的。
四、基于双峰平均值的阈值
1、描述:
该算法和基于谷底最小值的阈值方法类似,只是最后一步不是取得双峰之间的谷底值,而是取双峰的平均值作为阈值。
2、参考代码:
public static int GetIntermodesThreshold(int[] HistGram)
{
int Y, Iter = 0, Index;
double[] HistGramC = new double[256]; // 基于精度问题,一定要用浮点数来处理,否则得不到正确的结果
double[] HistGramCC = new double[256]; // 求均值的过程会破坏前面的数据,因此需要两份数据
for (Y = 0; Y < 256; Y++)
{
HistGramC[Y] = HistGram[Y];
HistGramCC[Y] = HistGram[Y];
}
// 通过三点求均值来平滑直方图
while (IsDimodal(HistGramCC) == false) // 判断是否已经是双峰的图像了
{
HistGramCC[0] = (HistGramC[0] + HistGramC[0] + HistGramC[1]) / 3; // 第一点
for (Y = 1; Y < 255; Y++)
HistGramCC[Y] = (HistGramC[Y - 1] + HistGramC[Y] + HistGramC[Y + 1]) / 3; // 中间的点
HistGramCC[255] = (HistGramC[254] + HistGramC[255] + HistGramC[255]) / 3; // 最后一点
System.Buffer.BlockCopy(HistGramCC, 0, HistGramC, 0, 256 * sizeof(double)); // 备份数据,为下一次迭代做准备
Iter++;
if (Iter >= 10000) return -1; // 似乎直方图无法平滑为双峰的,返回错误代码
}
// 阈值为两峰值的平均值
int[] Peak = new int[2];
for (Y = 1, Index = 0; Y < 255; Y++)
if (HistGramCC[Y - 1] < HistGramCC[Y] && HistGramCC[Y + 1] < HistGramCC[Y]) Peak[Index++] = Y - 1;
return ((Peak[0] + Peak[1]) / 2);
}
3、效果:


原图 二值图 原始直方图 平滑后的直方图
五、迭代最佳阈值
1、描述:
该算法先假定一个阈值,然后计算在该阈值下的前景和背景的中心值,当前景和背景中心值得平均值和假定的阈值相同时,则迭代中止,并以此值为阈值进行二值化。
2、实现过程:
(1)求出图象的最大灰度值和最小灰度值,分别记为gl和gu,令初始阈值为:

(2) 根据阈值T0将图象分割为前景和背景,分别求出两者的平均灰度值Ab和Af:

(3) 令

如果Tk=Tk+1,则取Tk为所求得的阈值,否则,转2继续迭代。
3、参考代码:
public static int GetIterativeBestThreshold(int[] HistGram)
{
int X, Iter = 0;
int MeanValueOne, MeanValueTwo, SumOne, SumTwo, SumIntegralOne, SumIntegralTwo;
int MinValue, MaxValue;
int Threshold, NewThreshold;
for (MinValue = 0; MinValue < 256 && HistGram[MinValue] == 0; MinValue++) ;
for (MaxValue = 255; MaxValue > MinValue && HistGram[MinValue] == 0; MaxValue--) ;
if (MaxValue == MinValue) return MaxValue; // 图像中只有一个颜色
if (MinValue + 1 == MaxValue) return MinValue; // 图像中只有二个颜色
Threshold = MinValue;
NewThreshold = (MaxValue + MinValue) >> 1;
while (Threshold != NewThreshold) // 当前后两次迭代的获得阈值相同时,结束迭代
{
SumOne = 0; SumIntegralOne = 0;
SumTwo = 0; SumIntegralTwo = 0;
Threshold = NewThreshold;
for (X = MinValue; X <= Threshold; X++) //根据阈值将图像分割成目标和背景两部分,求出两部分的平均灰度值
{
SumIntegralOne += HistGram[X] * X;
SumOne += HistGram[X];
}
MeanValueOne = SumIntegralOne / SumOne;
for (X = Threshold + 1; X <= MaxValue; X++)
{
SumIntegralTwo += HistGram[X] * X;
SumTwo += HistGram[X];
}
MeanValueTwo = SumIntegralTwo / SumTwo;
NewThreshold = (MeanValueOne + MeanValueTwo) >> 1; //求出新的阈值
Iter++;
if (Iter >= 1000) return -1;
}
return Threshold;
}
4、效果:


原图 二值图 直方图
六、OSTU大律法
1、描述:
该算法是1979年由日本大津提出的,主要是思想是取某个阈值,使得前景和背景两类的类间方差最大,matlab中的graythresh即是以该算法为原理执行的。
2、原理:
关于该算法的原理,网络上有很多,这里为了篇幅有限,不加以赘述。
3、参考代码:
public static int GetOSTUThreshold(int[] HistGram)
{
int X, Y, Amount = 0;
int PixelBack = 0, PixelFore = 0, PixelIntegralBack = 0, PixelIntegralFore = 0, PixelIntegral = 0;
double OmegaBack, OmegaFore, MicroBack, MicroFore, SigmaB, Sigma; // 类间方差;
int MinValue, MaxValue;
int Threshold = 0;
for (MinValue = 0; MinValue < 256 && HistGram[MinValue] == 0; MinValue++) ;
for (MaxValue = 255; MaxValue > MinValue && HistGram[MinValue] == 0; MaxValue--) ;
if (MaxValue == MinValue) return MaxValue; // 图像中只有一个颜色
if (MinValue + 1 == MaxValue) return MinValue; // 图像中只有二个颜色
for (Y = MinValue; Y <= MaxValue; Y++) Amount += HistGram[Y]; // 像素总数
PixelIntegral = 0;
for (Y = MinValue; Y <= MaxValue; Y++) PixelIntegral += HistGram[Y] * Y;
SigmaB = -1;
for (Y = MinValue; Y < MaxValue; Y++)
{
PixelBack = PixelBack + HistGram[Y];
PixelFore = Amount - PixelBack;
OmegaBack = (double)PixelBack / Amount;
OmegaFore = (double)PixelFore / Amount;
PixelIntegralBack += HistGram[Y] * Y;
PixelIntegralFore = PixelIntegral - PixelIntegralBack;
MicroBack = (double)PixelIntegralBack / PixelBack;
MicroFore = (double)PixelIntegralFore / PixelFore;
Sigma = OmegaBack * OmegaFore * (MicroBack - MicroFore) * (MicroBack - MicroFore);
if (Sigma > SigmaB)
{
SigmaB = Sigma;
Threshold = Y;
}
}
return Threshold;
}
4、效果:


该算法对于那些具有平坦的直方图的图像具有一定的适应能力。
七、一维最大熵
1、描述:
该算法把信息论中熵的概念引入到图像中,通过计算阈值分割后两部分熵的和来判断阈值是否为最佳阈值。
2、算法原理
这方面的文章也比较多,留给读者自行去查找相关资料。
3、参考代码:
public static int Get1DMaxEntropyThreshold(int[] HistGram)
{
int X, Y,Amount=0;
double[] HistGramD = new double[256];
double SumIntegral, EntropyBack, EntropyFore, MaxEntropy;
int MinValue = 255, MaxValue = 0;
int Threshold = 0;
for (MinValue = 0; MinValue < 256 && HistGram[MinValue] == 0; MinValue++) ;
for (MaxValue = 255; MaxValue > MinValue && HistGram[MinValue] == 0; MaxValue--) ;
if (MaxValue == MinValue) return MaxValue; // 图像中只有一个颜色
if (MinValue + 1 == MaxValue) return MinValue; // 图像中只有二个颜色
for (Y = MinValue; Y <= MaxValue; Y++) Amount += HistGram[Y]; // 像素总数
for (Y = MinValue; Y <= MaxValue; Y++) HistGramD[Y] = (double)HistGram[Y] / Amount+1e-17;
MaxEntropy = double.MinValue; ;
for (Y = MinValue + 1; Y < MaxValue; Y++)
{
SumIntegral = 0;
for (X = MinValue; X <= Y; X++) SumIntegral += HistGramD[X];
EntropyBack = 0;
for (X = MinValue; X <= Y; X++) EntropyBack += (-HistGramD[X] / SumIntegral * Math.Log(HistGramD[X] / SumIntegral));
EntropyFore = 0;
for (X = Y + 1; X <= MaxValue; X++) EntropyFore += (-HistGramD[X] / (1 - SumIntegral) * Math.Log(HistGramD[X] / (1 - SumIntegral)));
if (MaxEntropy < EntropyBack + EntropyFore)
{
Threshold = Y;
MaxEntropy = EntropyBack + EntropyFore;
}
}
return Threshold;
}
八、力矩保持法
1、描述:
该算法通过选择恰当的阈值从而使得二值后的图像和原始的灰度图像具有三个相同的初始力矩值。
2、原理:
参考论文:W. Tsai, “Moment-preserving thresholding: a new approach,” Comput.Vision Graphics Image Process., vol. 29, pp. 377-393, 1985.
由于无法下载到该论文(收费的),仅仅给出从其他一些资料中找到的公式共享一下。

其中的ABC的函数可见代码部分。
3、参考代码:
public static byte GetMomentPreservingThreshold(int[] HistGram)
{
int X, Y, Index = 0, Amount=0;
double[] Avec = new double[256];
double X2, X1, X0, Min;
for (Y = 0; Y <= 255; Y++) Amount += HistGram[Y]; // 像素总数
for (Y = 0; Y < 256; Y++) Avec[Y] = (double)A(HistGram, Y) / Amount; // The threshold is chosen such that A(y,t)/A(y,n) is closest to x0.
// The following finds x0.
X2 = (double)(B(HistGram, 255) * C(HistGram, 255) - A(HistGram, 255) * D(HistGram, 255)) / (double)(A(HistGram, 255) * C(HistGram, 255) - B(HistGram, 255) * B(HistGram, 255));
X1 = (double)(B(HistGram, 255) * D(HistGram, 255) - C(HistGram, 255) * C(HistGram, 255)) / (double)(A(HistGram, 255) * C(HistGram, 255) - B(HistGram, 255) * B(HistGram, 255));
X0 = 0.5 - (B(HistGram, 255) / A(HistGram, 255) + X2 / 2) / Math.Sqrt(X2 * X2 - 4 * X1);
for (Y = 0, Min = double.MaxValue; Y < 256; Y++)
{
if (Math.Abs(Avec[Y] - X0) < Min)
{
Min = Math.Abs(Avec[Y] - X0);
Index = Y;
}
}
return (byte)Index;
}
private static double A(int[] HistGram, int Index)
{
double Sum = 0;
for (int Y = 0; Y <= Index; Y++)
Sum += HistGram[Y];
return Sum;
}
private static double B(int[] HistGram, int Index)
{
double Sum = 0;
for (int Y = 0; Y <= Index; Y++)
Sum += (double)Y * HistGram[Y];
return Sum;
}
private static double C(int[] HistGram, int Index)
{
double Sum = 0;
for (int Y = 0; Y <= Index; Y++)
Sum += (double)Y * Y * HistGram[Y];
return Sum;
}
private static double D(int[] HistGram, int Index)
{
double Sum = 0;
for (int Y = 0; Y <= Index; Y++)
Sum += (double)Y * Y * Y * HistGram[Y];
return Sum;
}
对于很多图像,该算法页能取得比较满意的结果。
九、基于模糊集理论的阈值
该算法的具体分析可见:基于模糊集理论的一种图像二值化算法的原理、实现效果及代码
此法也借用香农熵的概念,该算法一般都能获得较为理想的分割效果,不管是对双峰的还是单峰的图像。
十、Kittler最小错误分类法
由于精力有限,以下几种算法仅仅给出算法的论文及相关的代码。
该算法具体的分析见:
- Kittler, J & Illingworth, J (1986), "Minimum error thresholding", Pattern Recognition 19: 41-47
参考代码:
public static int GetKittlerMinError(int[] HistGram)
{
int X, Y;
int MinValue, MaxValue;
int Threshold ;
int PixelBack, PixelFore;
double OmegaBack, OmegaFore, MinSigma, Sigma, SigmaBack, SigmaFore;
for (MinValue = 0; MinValue < 256 && HistGram[MinValue] == 0; MinValue++) ;
for (MaxValue = 255; MaxValue > MinValue && HistGram[MinValue] == 0; MaxValue--) ;
if (MaxValue == MinValue) return MaxValue; // 图像中只有一个颜色
if (MinValue + 1 == MaxValue) return MinValue; // 图像中只有二个颜色
Threshold = -1;
MinSigma = 1E+20;
for (Y = MinValue; Y < MaxValue; Y++)
{
PixelBack = 0; PixelFore = 0;
OmegaBack = 0; OmegaFore = 0;
for (X = MinValue; X <= Y; X++)
{
PixelBack += HistGram[X];
OmegaBack = OmegaBack + X * HistGram[X];
}
for (X = Y + 1; X <= MaxValue; X++)
{
PixelFore += HistGram[X];
OmegaFore = OmegaFore + X * HistGram[X];
}
OmegaBack = OmegaBack / PixelBack;
OmegaFore = OmegaFore / PixelFore;
SigmaBack = 0; SigmaFore = 0;
for (X = MinValue; X <= Y; X++) SigmaBack = SigmaBack + (X - OmegaBack) * (X - OmegaBack) * HistGram[X];
for (X = Y + 1; X <= MaxValue; X++) SigmaFore = SigmaFore + (X - OmegaFore) * (X - OmegaFore) * HistGram[X];
if (SigmaBack == 0 || SigmaFore == 0)
{
if (Threshold == -1)
Threshold = Y;
}
else
{
SigmaBack = Math.Sqrt(SigmaBack / PixelBack);
SigmaFore = Math.Sqrt(SigmaFore / PixelFore);
Sigma = 1 + 2 * (PixelBack * Math.Log(SigmaBack / PixelBack) + PixelFore * Math.Log(SigmaFore / PixelFore));
if (Sigma < MinSigma)
{
MinSigma = Sigma;
Threshold = Y;
}
}
}
return Threshold;
}从实际的运行效果看,该算法并不很好。
十一:ISODATA(也叫做intermeans法)
参考论文:
- Ridler, TW & Calvard, S (1978), "Picture thresholding using an iterative selection method", IEEE Transactions on Systems, Man and Cybernetics 8: 630-632, <http://ieeexplore.ieee.org/xpls/abs_all.jsp?arnumber=4310039>
参考代码(未做整理):
// Also called intermeans
// Iterative procedure based on the isodata algorithm [T.W. Ridler, S. Calvard, Picture
// thresholding using an iterative selection method, IEEE Trans. System, Man and
// Cybernetics, SMC-8 (1978) 630-632.]
// The procedure divides the image into objects and background by taking an initial threshold,
// then the averages of the pixels at or below the threshold and pixels above are computed.
// The averages of those two values are computed, the threshold is incremented and the
// process is repeated until the threshold is larger than the composite average. That is,
// threshold = (average background + average objects)/2
// The code in ImageJ that implements this function is the getAutoThreshold() method in the ImageProcessor class.
//
// From: Tim Morris (dtm@ap.co.umist.ac.uk)
// Subject: Re: Thresholding method?
// posted to sci.image.processing on 1996/06/24
// The algorithm implemented in NIH Image sets the threshold as that grey
// value, G, for which the average of the averages of the grey values
// below and above G is equal to G. It does this by initialising G to the
// lowest sensible value and iterating:
// L = the average grey value of pixels with intensities < G
// H = the average grey value of pixels with intensities > G
// is G = (L + H)/2?
// yes => exit
// no => increment G and repeat
//
// There is a discrepancy with IJ because they are slightly different methods
public static int GetIsoDataThreshold(int[] HistGram)
{
int i, l, toth, totl, h, g = 0;
for (i = 1; i < HistGram.Length; i++)
{
if (HistGram[i] > 0)
{
g = i + 1;
break;
}
}
while (true)
{
l = 0;
totl = 0;
for (i = 0; i < g; i++)
{
totl = totl + HistGram[i];
l = l + (HistGram[i] * i);
}
h = 0;
toth = 0;
for (i = g + 1; i < HistGram.Length; i++)
{
toth += HistGram[i];
h += (HistGram[i] * i);
}
if (totl > 0 && toth > 0)
{
l /= totl;
h /= toth;
if (g == (int)Math.Round((l + h) / 2.0))
break;
}
g++;
if (g > HistGram.Length - 2)
{
return 0;
}
}
return g;
}十二、Shanbhag 法
参考论文:
Shanbhag, Abhijit G. (1994), "Utilization of information measure as a means of image thresholding", Graph. Models Image Process. (Academic Press, Inc.) 56 (5): 414--419, ISSN 1049-9652, DOI 10.1006/cgip.1994.1037
参考代码(未整理):
public static int GetShanbhagThreshold(int[] HistGram)
{
int threshold;
int ih, it;
int first_bin;
int last_bin;
double term;
double tot_ent; /* total entropy */
double min_ent; /* max entropy */
double ent_back; /* entropy of the background pixels at a given threshold */
double ent_obj; /* entropy of the object pixels at a given threshold */
double[] norm_histo = new double[HistGram.Length]; /* normalized histogram */
double[] P1 = new double[HistGram.Length]; /* cumulative normalized histogram */
double[] P2 = new double[HistGram.Length];
int total = 0;
for (ih = 0; ih < HistGram.Length; ih++)
total += HistGram[ih];
for (ih = 0; ih < HistGram.Length; ih++)
norm_histo[ih] = (double)HistGram[ih] / total;
P1[0] = norm_histo[0];
P2[0] = 1.0 - P1[0];
for (ih = 1; ih < HistGram.Length; ih++)
{
P1[ih] = P1[ih - 1] + norm_histo[ih];
P2[ih] = 1.0 - P1[ih];
}
/* Determine the first non-zero bin */
first_bin = 0;
for (ih = 0; ih < HistGram.Length; ih++)
{
if (!(Math.Abs(P1[ih]) < 2.220446049250313E-16))
{
first_bin = ih;
break;
}
}
/* Determine the last non-zero bin */
last_bin = HistGram.Length - 1;
for (ih = HistGram.Length - 1; ih >= first_bin; ih--)
{
if (!(Math.Abs(P2[ih]) < 2.220446049250313E-16))
{
last_bin = ih;
break;
}
}
// Calculate the total entropy each gray-level
// and find the threshold that maximizes it
threshold = -1;
min_ent = Double.MaxValue;
for (it = first_bin; it <= last_bin; it++)
{
/* Entropy of the background pixels */
ent_back = 0.0;
term = 0.5 / P1[it];
for (ih = 1; ih <= it; ih++)
{ //0+1?
ent_back -= norm_histo[ih] * Math.Log(1.0 - term * P1[ih - 1]);
}
ent_back *= term;
/* Entropy of the object pixels */
ent_obj = 0.0;
term = 0.5 / P2[it];
for (ih = it + 1; ih < HistGram.Length; ih++)
{
ent_obj -= norm_histo[ih] * Math.Log(1.0 - term * P2[ih]);
}
ent_obj *= term;
/* Total entropy */
tot_ent = Math.Abs(ent_back - ent_obj);
if (tot_ent < min_ent)
{
min_ent = tot_ent;
threshold = it;
}
}
return threshold;
}十三、Yen法
参考论文:
1) Yen J.C., Chang F.J., and Chang S. (1995) "A New Criterion for Automatic Multilevel Thresholding" IEEE Trans. on Image Processing, 4(3): 370-378
2) Sezgin M. and Sankur B. (2004) "Survey over Image Thresholding Techniques and Quantitative Performance Evaluation" Journal of Electronic Imaging, 13(1): 146-165
参考代码(未整理):
// M. Emre Celebi
// 06.15.2007
// Ported to ImageJ plugin by G.Landini from E Celebi's fourier_0.8 routines
public static int GetYenThreshold(int[] HistGram)
{
int threshold;
int ih, it;
double crit;
double max_crit;
double[] norm_histo = new double[HistGram.Length]; /* normalized histogram */
double[] P1 = new double[HistGram.Length]; /* cumulative normalized histogram */
double[] P1_sq = new double[HistGram.Length];
double[] P2_sq = new double[HistGram.Length];
int total = 0;
for (ih = 0; ih < HistGram.Length; ih++)
total += HistGram[ih];
for (ih = 0; ih < HistGram.Length; ih++)
norm_histo[ih] = (double)HistGram[ih] / total;
P1[0] = norm_histo[0];
for (ih = 1; ih < HistGram.Length; ih++)
P1[ih] = P1[ih - 1] + norm_histo[ih];
P1_sq[0] = norm_histo[0] * norm_histo[0];
for (ih = 1; ih < HistGram.Length; ih++)
P1_sq[ih] = P1_sq[ih - 1] + norm_histo[ih] * norm_histo[ih];
P2_sq[HistGram.Length - 1] = 0.0;
for (ih = HistGram.Length - 2; ih >= 0; ih--)
P2_sq[ih] = P2_sq[ih + 1] + norm_histo[ih + 1] * norm_histo[ih + 1];
/* Find the threshold that maximizes the criterion */
threshold = -1;
max_crit = Double.MinValue;
for (it = 0; it < HistGram.Length; it++)
{
crit = -1.0 * ((P1_sq[it] * P2_sq[it]) > 0.0 ? Math.Log(P1_sq[it] * P2_sq[it]) : 0.0) + 2 * ((P1[it] * (1.0 - P1[it])) > 0.0 ? Math.Log(P1[it] * (1.0 - P1[it])) : 0.0);
if (crit > max_crit)
{
max_crit = crit;
threshold = it;
}
}
return threshold;
}一行很多代码是摘自开源软件ImageJ的资料,读者也可以参考:http://fiji.sc/wiki/index.php/Auto_Threshold 这里获得更多的信息。
最后,我对这些算法的做了简单的UI界面,供有兴趣的读者参考。
工程代码下载:http://files.cnblogs.com/Imageshop/HistgramBinaryzation.rar


