图像:
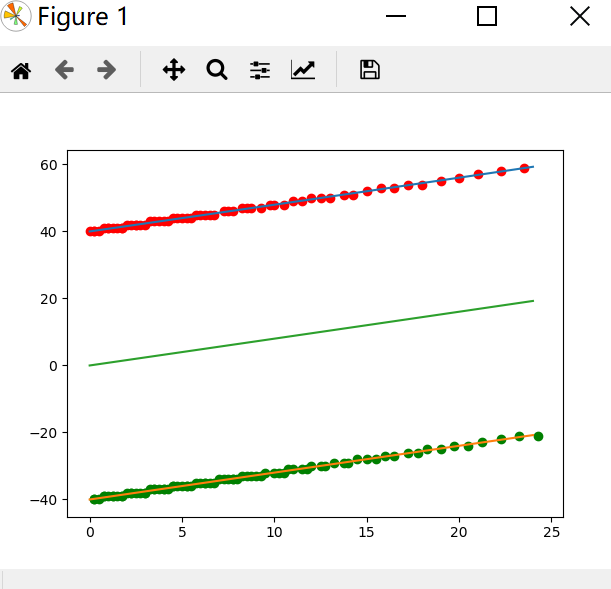
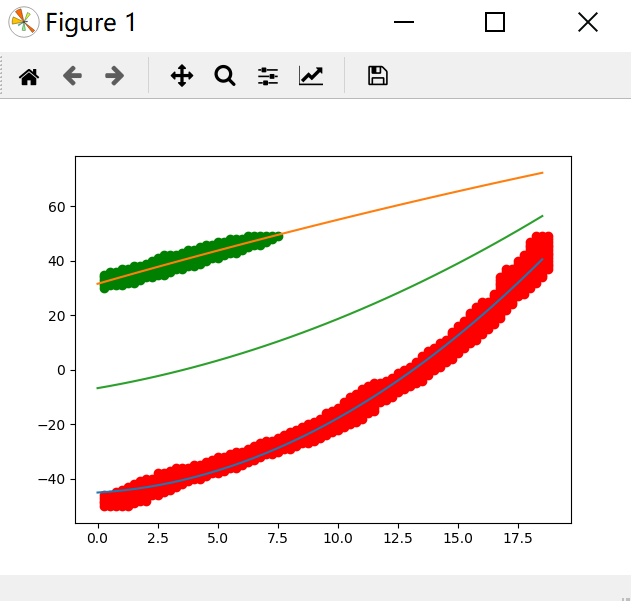
import cv2
import numpy as np
import matplotlib.pyplot as plt
import sklearn.cluster as skc
#import time as t

name = "7.jpg"
bin_method = 'b'
width = 100
height = 75
rate = (width*height/200.0/150.0)**0.5 #param scale rate
BlurPar = 15
fix_order = 2
cannyPar = 100

image = cv2.imread(name, 0)

def road_detect(image):
    # 预处理
    image = cv2.GaussianBlur(image, (BlurPar,BlurPar), 0)
    image = cv2.resize(image,(width, height))
    if bin_method == 'b':
        ret,image = cv2.threshold(image,0,255,cv2.THRESH_BINARY+cv2.THRESH_OTSU)
    else:
        image=cv2.Canny(image, cannyPar/2.5, cannyPar)
    line = []
    # 筛选点
    for i in range(0, image.shape[0]):
        for j in range(0, image.shape[1]):
            if image[i][j]>100:
                line.append([(image.shape[0]-i)/4.0, j-image.shape[1]/2.0])
    linea = np.asarray(line)
    # DBSCAN
    if bin_method == 'b':
        min_pts = 30*rate
    else:
        min_pts = 20*rate
    db=skc.DBSCAN(eps=16*rate,min_samples=min_pts).fit(linea)
    label_pred = db.labels_
    #n_clusters_ = len(set(label_pred)) - (1 if -1 in label_pred else 0)

    x0 = linea[label_pred == 0]
    x1 = linea[label_pred == 1]
    plt.scatter(x0[:, 0], x0[:, 1], c = "red") #####################
    plt.scatter(x1[:, 0], x1[:, 1], c = "green") #####################
    # 线性回归
    xt=np.arange(0,image.shape[0]/4,0.5) #####################

    line_model1 = np.polyfit(x0[:, 0], x0[:, 1], fix_order)
    yt1=np.fromiter(map(np.poly1d(line_model1),xt), dtype = float) #####################
    plt.plot(xt,yt1) #####################

    line_model2 = np.polyfit(x1[:, 0], x1[:, 1], fix_order)
    yt2=np.fromiter(map(np.poly1d(line_model2),xt), dtype = float) #####################
    plt.plot(xt,yt2) #####################

    line_model = line_model1+line_model2
    yt=np.fromiter(map(np.poly1d(line_model),xt), dtype = float)/2.0 #####################
    plt.plot(xt,yt) #####################
    print(np.poly1d(line_model)) #--------------------------#

    plt.show() #####################
    return line_model

#t1 = t.time()
road_detect(image)
#t2 = t.time()
#print("time : ",t2-t1) #--------------------------#
雷达
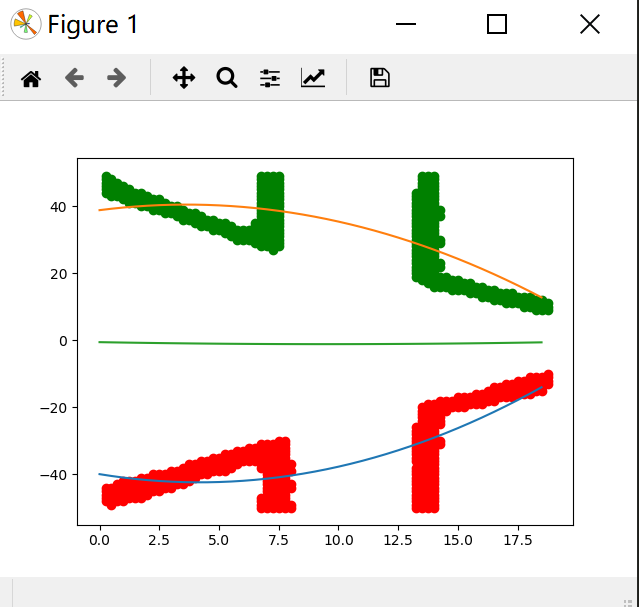
import math as m
import numpy as np
import matplotlib.pyplot as plt
import sklearn.cluster as skc

accuracy = 1 # cm
detect_range = 100 # cm
rotate_angle = 0
fix_order = 2
eps_par = 20 #聚类点距离

def road_laser_detect(ranges, range_max, range_min):
    line = []
    ymax = 0
    wh = detect_range//accuracy
    # 筛选点
    for i in range(360):
        if ranges[i]>range_min and ranges[i]<range_max:
            x = int(round(ranges[i] * 100 / accuracy * m.cos(m.radians(i+rotate_angle))))
            y = int(round(ranges[i] * 100 / accuracy * m.sin(m.radians(i+rotate_angle))))
            if abs(x)<wh and y < wh and y >= 0:
                line.append([y/4.0, x])
                if y>ymax:
                    ymax = y

    linea = np.asarray(line)
    # DBSCAN
    db=skc.DBSCAN(eps=eps_par, min_samples=10).fit(linea)
    label_pred = db.labels_
    #n_clusters_ = len(set(label_pred)) - (1 if -1 in label_pred else 0)

    x0 = linea[label_pred == 0]
    x1 = linea[label_pred == 1]
    plt.scatter(x0[:, 0], x0[:, 1], c = "red") ##################
    plt.scatter(x1[:, 0], x1[:, 1], c = "green") ##################
    # 线性回归
    xt=np.arange(0,ymax/4.0,0.5) #####################

    line_model1 = np.polyfit(x0[:, 0], x0[:, 1], fix_order)
    yt1=np.fromiter(map(np.poly1d(line_model1),xt), dtype = float) #####################
    plt.plot(xt,yt1) #####################

    line_model2 = np.polyfit(x1[:, 0], x1[:, 1], fix_order)
    yt2=np.fromiter(map(np.poly1d(line_model2),xt), dtype = float) #####################
    plt.plot(xt,yt2) #####################

    line_model = line_model1+line_model2
    yt=np.fromiter(map(np.poly1d(line_model),xt), dtype = float)/2.0 #####################
    plt.plot(xt,yt) #####################
    print(np.poly1d(line_model)) #--------------------------#

    plt.show() #####################
    return line_model

# 模拟数据测试
a=np.arange(0,360,dtype = np.int)
o = np.zeros(360)
for i in range(360):
    o[i] = m.radians(a[i])
p = np.zeros(360)
for i in range(360):
    if i < 90:
        p[i] = -2/(m.sin(o[i])-5*m.cos(o[i]))
    elif i >= 270:
        p[i] = 3/(m.sin(o[i])+5*m.cos(o[i]))
    elif i >= 90 and i <180:
        p[i] = 2/(m.sin(o[i])-5*m.cos(o[i]))
    else:
        p[i] = -3/(m.sin(o[i])+5*m.cos(o[i]))

road_laser_detect(p, 10, 0.1)
图像:
 ===》
===》 
 ===》
===》 
雷达: