1.prometheus服务端监控安装
# cd /usr/local/
# wget https://github.com/prometheus/prometheus/releases/download/v2.21.0/prometheus-2.21.0.linux-amd64.tar.gz
# tar xf prometheus-2.21.0-rc.0.linux-amd64.tar.gz
# ln -sv prometheus-2.21.0-rc.0.linux-amd64 prometheus
# /usr/local/prometheus/promtool check config prometheus.yml
# /usr/local/prometheus/prometheus --config.file=/usr/local/prometheus/prometheus.yml &
安装完成并启动后可以查询日志输出:tail -f /var/log/messages
prometheus监控进程以及端口信息:
[root@master prometheus]# ps -ef|grep prometheus
root      10630  10412  0 17:12 pts/0    00:00:06 /usr/local/prometheus/prometheus --config.file=/usr/local/prometheus/prometheus.yml
root      10848  10412  0 17:46 pts/0    00:00:00 grep --color=auto prometheus

[root@master prometheus]# lsof -i :9090
COMMAND     PID USER   FD   TYPE DEVICE SIZE/OFF NODE NAME
prometheu 10630 root    3u  IPv6  34901      0t0  TCP localhost:59090->localhost:websm (ESTABLISHED)
prometheu 10630 root    8u  IPv6  34894      0t0  TCP *:websm (LISTEN)
prometheu 10630 root    9u  IPv4  34268      0t0  TCP localhost:52242->localhost:websm (ESTABLISHED)
prometheu 10630 root   11u  IPv6  34897      0t0  TCP localhost:websm->localhost:52242 (ESTABLISHED)
prometheu 10630 root   13u  IPv6  33279      0t0  TCP localhost:websm->localhost:59090 (ESTABLISHED)
确认prometheus服务安装没有问题后,可以通过prometheus内置的控制台进行访问:
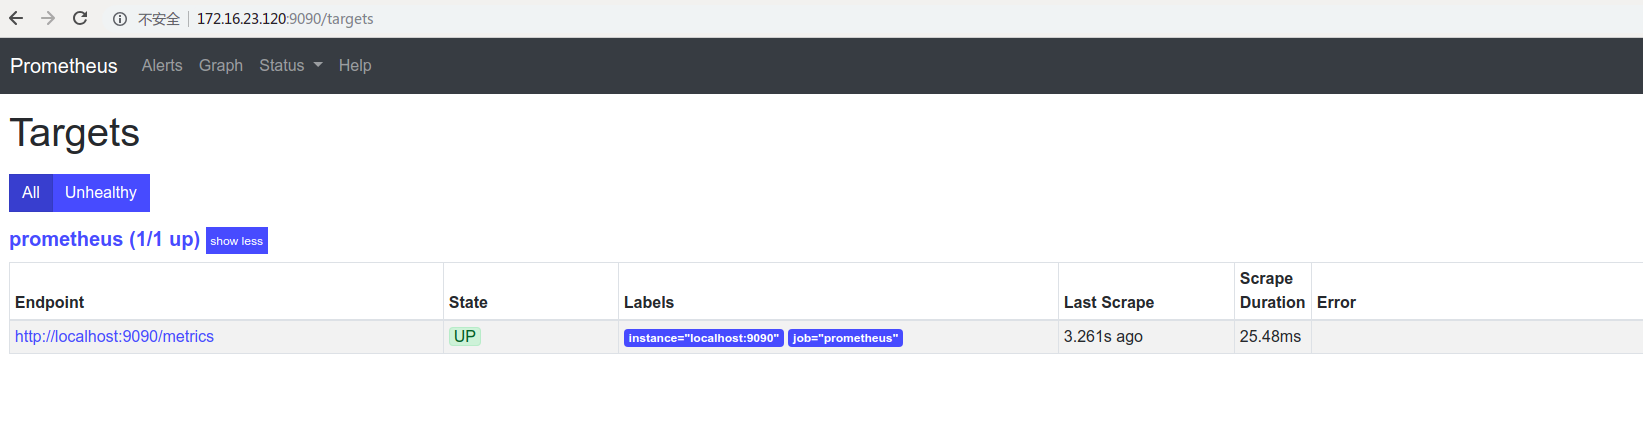
当然也可以查询采集的数据:

prometheus将其可以拉取数据指标的来源称之为endpoint,endpoint可以是各种exporter或者应用程序.然后为了拉取endpoint的数据,prometheus定义了名为target的配置,告诉拉取时要如何进行连接等信息,多个具有相同功能角色的target组合在一起就构成了一个job.例如,具有相同用途的一组主机的资源监控器node_exporter或者mysql数据库的监控器mysqld_exporter
prometheus默认是将收集到的时间序列的数据存储在本地tsdb数据库中,且默认只保留15天,也可以配置发送到其他时间序列数据库中
2.监控linux机器node_exporter安装
# cd /usr/local/
# wget https://github.com/prometheus/node_exporter/releases/download/v1.0.1/node_exporter-1.0.1.linux-amd64.tar.gz
# tar xf node_exporter-1.0.1.linux-amd64.tar.gz
# ln -sv node_exporter-1.0.1.linux-amd64 node_exporter
启动node_exporter程序:
[root@master local]# cat /usr/lib/systemd/system/node_exporter.service
[Unit]
Description=node_exporter

[Service]
ExecStart=/usr/local/node_exporter/node_exporter
--web.listen-address=:9100
--collector.systemd
--collector.systemd.unit-whitelist="(ssh|docker|rsyslog|redis-server).service"

Restart=on-failure

[Install]
WantedBy=mutil-user.target

# systemctl enable node_exporter
# systemctl start node_exporter
# ps -ef|grep node
# lsof -i:9100
# tail -f /var/log/messages
现在修改prometheus服务端配置文件将node_exporter节点添加到job中:
# cp prometheus.yml prometheus.yml.bak20200920
[root@master prometheus]# cat prometheus.yml
# my global config
global:
  scrape_interval:     15s # Set the scrape interval to every 15 seconds. Default is every 1 minute.
  evaluation_interval: 15s # Evaluate rules every 15 seconds. The default is every 1 minute.
  # scrape_timeout is set to the global default (10s).

# Alertmanager configuration
alerting:
  alertmanagers:
  - static_configs:
    - targets:
      # - alertmanager:9093

# Load rules once and periodically evaluate them according to the global 'evaluation_interval'.
rule_files:
  # - "first_rules.yml"
  # - "second_rules.yml"

# A scrape configuration containing exactly one endpoint to scrape:
# Here it's Prometheus itself.
scrape_configs:
  # The job name is added as a label `job=<job_name>` to any timeseries scraped from this config.
  - job_name: 'prometheus'

    # metrics_path defaults to '/metrics'
    # scheme defaults to 'http'.

    static_configs:
    - targets: ['localhost:9090']

  - job_name: 'linux_node'       # 新增下面几行,prometheus会自动pull从node_exporter的数据到tsdb中
    static_configs:
    - targets: ['172.16.23.120:9100']
      labels:
        nodename: master
        role: master

# 检查语法:
[root@master prometheus]# ./promtool check config prometheus.yml
Checking prometheus.yml
SUCCESS: 0 rule files found
重启prometheus服务端:
[root@master prometheus]# ps -ef|grep prometheus
root      10630  10412  0 17:12 pts/0    00:00:12 /usr/local/prometheus/prometheus --config.file=/usr/local/prometheus/prometheus.yml
root      11167  10412  0 18:26 pts/0    00:00:00 grep --color=auto prometheus
[root@master prometheus]# kill 10630
level=warn ts=2020-09-20T10:27:01.529Z caller=main.go:551 msg="Received SIGTERM, exiting gracefully..."
[root@master prometheus]# level=info ts=2020-09-20T10:27:01.529Z caller=main.go:574 msg="Stopping scrape discovery manager..."
level=info ts=2020-09-20T10:27:01.529Z caller=main.go:588 msg="Stopping notify discovery manager..."
level=info ts=2020-09-20T10:27:01.529Z caller=main.go:610 msg="Stopping scrape manager..."
level=info ts=2020-09-20T10:27:01.529Z caller=main.go:584 msg="Notify discovery manager stopped"
level=info ts=2020-09-20T10:27:01.529Z caller=main.go:570 msg="Scrape discovery manager stopped"
level=info ts=2020-09-20T10:27:01.529Z caller=manager.go:908 component="rule manager" msg="Stopping rule manager..."
level=info ts=2020-09-20T10:27:01.529Z caller=manager.go:918 component="rule manager" msg="Rule manager stopped"
level=info ts=2020-09-20T10:27:01.529Z caller=main.go:604 msg="Scrape manager stopped"
level=info ts=2020-09-20T10:27:01.532Z caller=notifier.go:601 component=notifier msg="Stopping notification manager..."
level=info ts=2020-09-20T10:27:01.532Z caller=main.go:778 msg="Notifier manager stopped"
level=info ts=2020-09-20T10:27:01.533Z caller=main.go:790 msg="See you next time!"

[1]+  完成                  /usr/local/prometheus/prometheus --config.file=/usr/local/prometheus/prometheus.yml
[root@master prometheus]# /usr/local/prometheus/prometheus --config.file=/usr/local/prometheus/prometheus.yml &
[1] 11174
[root@master prometheus]# level=info ts=2020-09-20T10:28:01.627Z caller=main.go:310 msg="No time or size retention was set so using the default time retention" duration=15d
level=info ts=2020-09-20T10:28:01.628Z caller=main.go:346 msg="Starting Prometheus" version="(version=2.21.0-rc.0, branch=HEAD, revision=1195cc24e3c8b9af8aeafcfc46473f6486ca3f64)"
level=info ts=2020-09-20T10:28:01.628Z caller=main.go:347 build_context="(go=go1.15, user=root@1e754dfec932, date=20200827-23:23:27)"
level=info ts=2020-09-20T10:28:01.628Z caller=main.go:348 host_details="(Linux 3.10.0-862.el7.x86_64 #1 SMP Fri Apr 20 16:44:24 UTC 2018 x86_64 master (none))"
level=info ts=2020-09-20T10:28:01.628Z caller=main.go:349 fd_limits="(soft=1024, hard=4096)"
level=info ts=2020-09-20T10:28:01.628Z caller=main.go:350 vm_limits="(soft=unlimited, hard=unlimited)"
level=info ts=2020-09-20T10:28:01.630Z caller=main.go:701 msg="Starting TSDB ..."
level=info ts=2020-09-20T10:28:01.630Z caller=web.go:523 component=web msg="Start listening for connections" address=0.0.0.0:9090
level=info ts=2020-09-20T10:28:01.636Z caller=head.go:644 component=tsdb msg="Replaying on-disk memory mappable chunks if any"
level=info ts=2020-09-20T10:28:01.636Z caller=head.go:658 component=tsdb msg="On-disk memory mappable chunks replay completed" duration=229.637µs
level=info ts=2020-09-20T10:28:01.636Z caller=head.go:664 component=tsdb msg="Replaying WAL, this may take a while"
level=info ts=2020-09-20T10:28:01.647Z caller=head.go:716 component=tsdb msg="WAL segment loaded" segment=0 maxSegment=1
level=info ts=2020-09-20T10:28:01.648Z caller=head.go:716 component=tsdb msg="WAL segment loaded" segment=1 maxSegment=1
level=info ts=2020-09-20T10:28:01.648Z caller=head.go:719 component=tsdb msg="WAL replay completed" checkpoint_replay_duration=28.179µs wal_replay_duration=10.994542ms total_replay_duration=11.274975ms
level=info ts=2020-09-20T10:28:01.649Z caller=main.go:721 fs_type=XFS_SUPER_MAGIC
level=info ts=2020-09-20T10:28:01.649Z caller=main.go:724 msg="TSDB started"
level=info ts=2020-09-20T10:28:01.649Z caller=main.go:850 msg="Loading configuration file" filename=/usr/local/prometheus/prometheus.yml
level=info ts=2020-09-20T10:28:01.650Z caller=main.go:881 msg="Completed loading of configuration file" filename=/usr/local/prometheus/prometheus.yml totalDuration=691.925µs remote_storage=8.401µs web_handler=412ns query_engine=975ns scrape=292.136µs scrape_sd=62.841µs notify=25.538µs notify_sd=9.268µs rules=2.757µs
level=info ts=2020-09-20T10:28:01.650Z caller=main.go:673 msg="Server is ready to receive web requests."
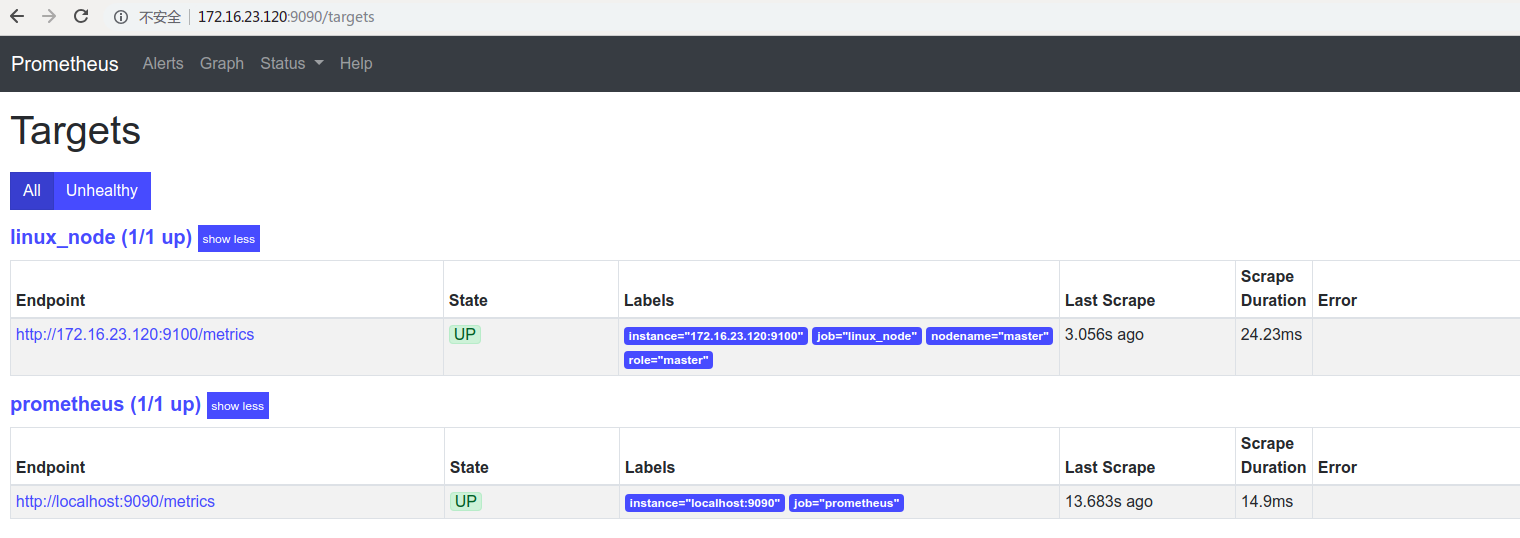
然后刷新prometheus控制台:
将prometheus服务端设置为系统服务:
[root@master prometheus]# cat /usr/lib/systemd/system/prometheus.service
[Unit]
Description=prometheus


[Service]
ExecStart=/usr/local/prometheus/prometheus --config.file=/usr/local/prometheus/prometheus.yml --storage.tsdb.path=/data/prometheus --web.enable-lifecycle --storage.tsdb.retention.time=180d

Restart=on-failure

[Install]
WantedBy=multi-user.target

# systemctl enable prometheus
然后将当前的prometheus进程停止启动服务方式:
# systemctl start prometheus
[root@master prometheus]# ps -ef|grep prometheus
root      11252      1  5 18:34 ?        00:00:00 /usr/local/prometheus/prometheus --config.file=/usr/local/prometheus/prometheus.yml --storage.tsdb.path=/data/prometheus --web.enable-lifecycle --storage.tsdb.retention.time=180d
root      11263  10412  0 18:34 pts/0    00:00:00 grep --color=auto prometheus