import numpy as np
import pandas as pd
from matplotlib import pyplot as plt
data = pd.DataFrame([[1,2,3],[11,22,33],[111,222,333]])

data.plot()  #plot()默认的线性图

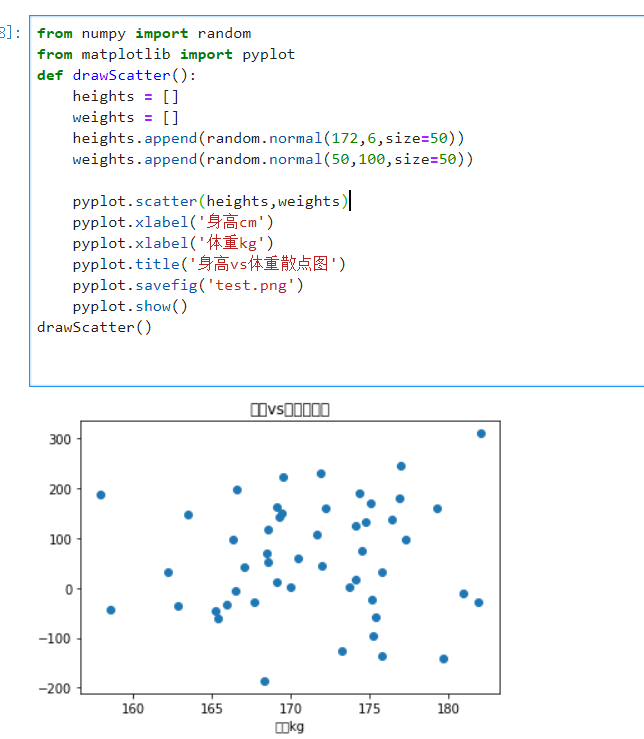
#点状随机图
from numpy import random
from matplotlib import pyplot
def drawScatter():
heights = []
weights = []
heights.append(random.normal(172,6,size=50))
weights.append(random.normal(50,100,size=50))

pyplot.scatter(heights,weights)
pyplot.xlabel('身高cm')
pyplot.xlabel('体重kg')
pyplot.title('身高vs体重散点图')
pyplot.savefig('test.png')
pyplot.show()
drawScatter()