一.安装目前最流行的包之一 matplotlib
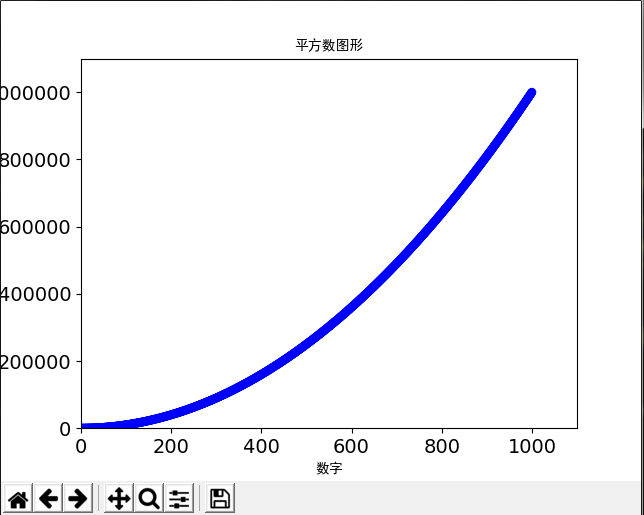
1.绘制简单的折线图
import matplotlib.pyplot as plt

input_values = [1, 2, 3, 4, 5, 6, 7, 8]
squares = [1, 4, 9, 16, 25, 36, 49, 64]
#linewidth线条粗细
plt.plot(input_values, squares, linewidth=5)

#设置图标标题,fontproperties字体变量
plt.title("平方数图形",fontproperties='SimHei', fontsize=14)
#给x轴设置标题
plt.xlabel("数字", fontproperties='SimHei',fontsize=14)
#给y轴设置标题
plt.ylabel("数的平方", fontproperties='SimHei',fontsize=14)

#设置刻度标记的大小
plt.tick_params(axis='both', labelsize=14)

plt.show()
运行之后

2.绘制散点图
import matplotlib.pyplot as plt

#x轴是一个列表
x_values = list(range(1, 1001))
#y轴用x的值遍历之后平方
y_values = [x**2 for x in x_values]
#使用scatter函数生成散点图,参数c设置要使用的颜色
plt.scatter(x_values, y_values, c='blue', edgecolor='none', s=40)

plt.title("平方数图形",fontproperties='SimHei',fontsize=10)
plt.xlabel("数字", fontproperties='SimHei',fontsize=10)
plt.ylabel("数的平方", fontproperties='SimHei',fontsize=10)

# 设置刻度标记
plt.tick_params(axis='both', which='major', labelsize=14)

# 设置x,y轴的坐标范围
plt.axis([0, 1100, 0, 1100000])

plt.show()
如果要保存图表可以将
plt.show( )改为 plt.savefig('shu.png',bbox_inches='tight')
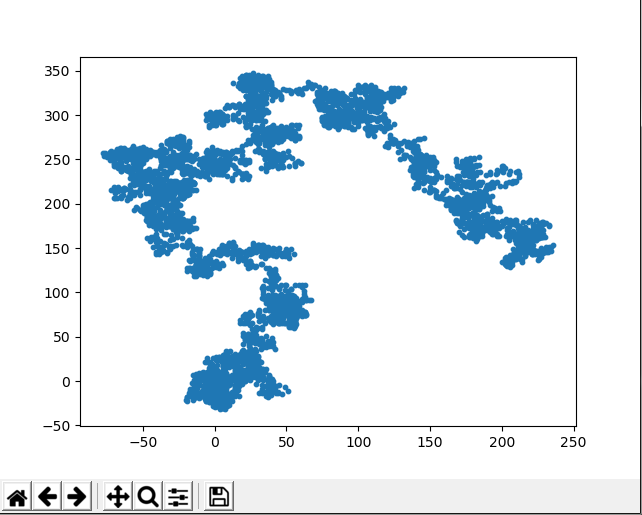
3.随机漫步
随机漫步是又一系列随机决策决定的,模拟随机漫步要先创建RandomWalk( )类
from random import choice


class RandomWalk():


    def __init__(self, num_points=5000):
        #设置5000个随机点
        self.num_points = num_points

        # 所有随机点都是从(0,0)开始.
        self.x_values = [0]
        self.y_values = [0]

    def fill_walk(self):
        #判断x轴有没有到达设置的长度
        while len(self.x_values) < self.num_points:

            #判断随机点的发现是前进还是后退
            x_direction = choice([1, -1])
            #每一次走多远,随机产生一个
            x_distance = choice([0, 1, 2, 3, 4])
            #x轴移动距离
            x_step = x_direction * x_distance

            y_direction = choice([1, -1])
            y_distance = choice([0, 1, 2, 3, 4])
            y_step = y_direction * y_distance

            # 判断是否原地不动
            if x_step == 0 and y_step == 0:
                continue

            # 计算下一个点
            next_x = self.x_values[-1] + x_step
            next_y = self.y_values[-1] + y_step
            #将下一个点添加到列表x_values,y_values后面
            self.x_values.append(next_x)
            self.y_values.append(next_y)
下面将随机慢点所有的点都绘制出来
from random_walk import RandomWalk
import matplotlib.pyplot as plt
rw=RandomWalk()
rw.fill_walk()
plt.scatter(rw.x_values,rw.y_values,s=10)
plt.show()