1.csv文件读取,csv文件是常用的数据存储格式之一,我们使用Python模块来处理csv文件,这是一个天气信息表
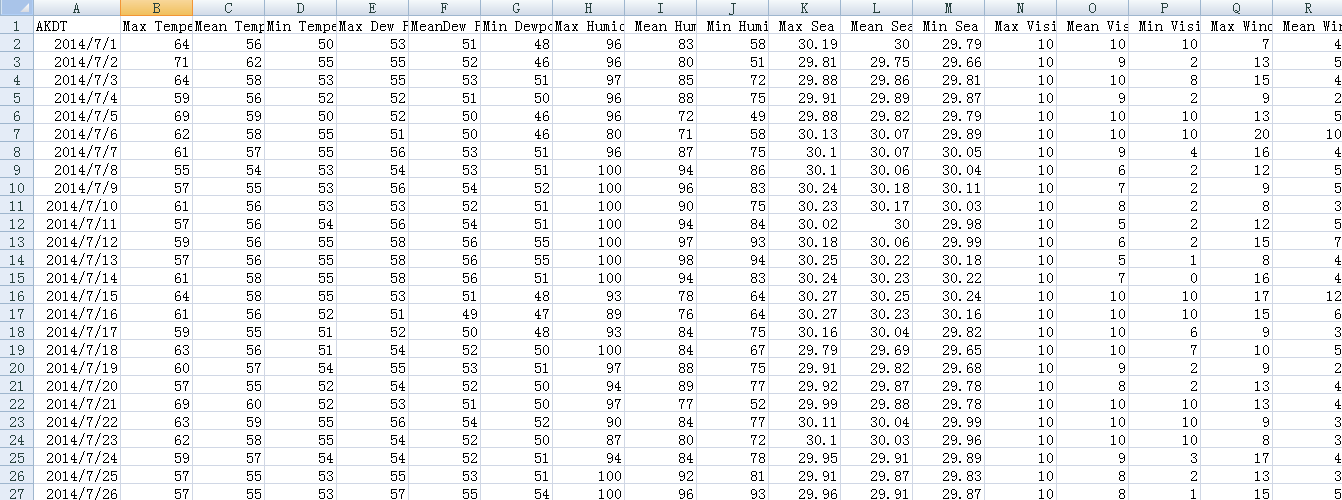
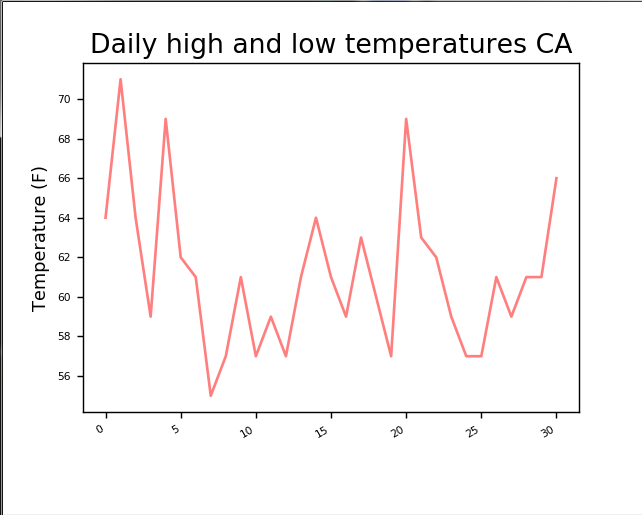
import csv
from matplotlib import pyplot as plt

filename = 'sitka_weather_07-2014.csv'
with open(filename) as f:
    #从文件获取数据
    reader = csv.reader(f)
    #获取数据的第一行也就是数据字段
    header_row = next(reader)
    #print(header_row)
    #遍历读取到的第一行数据使用enumerate函数来获取每个元素的索引和值
    # for index ,column_header in enumerate(header_row):
    #     print(index,column_header)

    highs=[]
    #从文件获取到最高气温
    for row in reader:
        highs.append(int(row[1]))
    print(highs)
    fig = plt.figure(dpi=128, figsize=(10, 6))
    plt.plot(highs, c='red', alpha=0.5)
    #plt.plot(dates, lows, c='blue', alpha=0.5)
    #plt.fill_between(dates, highs, lows, facecolor='blue', alpha=0.1)


    title = "Daily high and low temperatures CA"
    plt.title(title, fontsize=20)
    plt.xlabel('', fontsize=16)
    fig.autofmt_xdate()
    plt.ylabel("Temperature (F)", fontsize=16)
    plt.tick_params(axis='both', which='major', labelsize=16)

    plt.show()
除了这样显示,我们还可以读取时间数据显示在x轴上,添加datetime模块
from datetime import datetime
读取时间数据
filename = 'sitka_weather_07-2014.csv'
with open(filename) as f:
    #从文件获取数据
    reader = csv.reader(f)
    #获取数据的第一行也就是数据字段
    header_row = next(reader)
    #print(header_row)
    #遍历读取到的第一行数据使用enumerate函数来获取每个元素的索引和值
    # for index ,column_header in enumerate(header_row):
    #     print(index,column_header)

    highs,dates=[],[]
    #从文件获取到最高气温
    for row in reader:
        #从文件获取日期
        current_date=datetime.strptime(row[0],"%Y-%m-%d")
        dates.append(current_date)
        highs.append(int(row[1]))
    print(highs,dates)
    fig = plt.figure(dpi=128, figsize=(5, 4))
    #添加日期
    plt.plot(dates,highs, c='red', alpha=0.5)
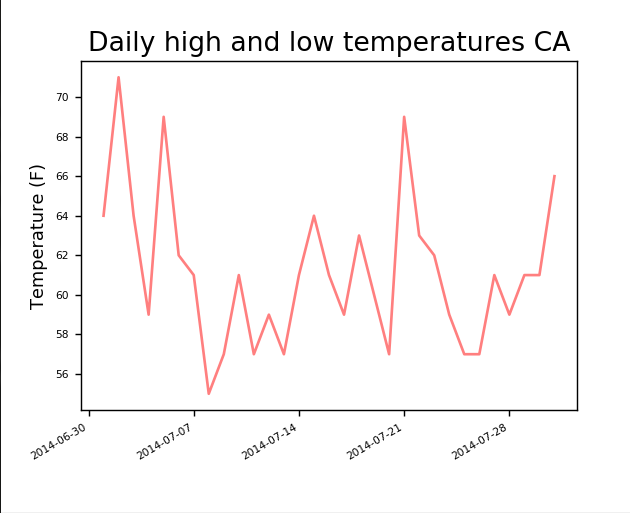
图中是一个月的天气温度情况
当然还可以读取整年的天气情况,只要有足够的数据
2.绘制一个数据系列,对比全年每个月的最高气温和最低气温
import csv
from datetime import datetime

from matplotlib import pyplot as plt

filename = 'death_valley_2014.csv'
with open(filename) as f:
    reader = csv.reader(f)
    header_row = next(reader)

    dates, highs, lows = [], [], []
    for row in reader:
        #判断是否有时间信息
        try:
            current_date = datetime.strptime(row[0], "%Y-%m-%d")
            high = int(row[1])
            #读取最低温数据
            low = int(row[3])
        except ValueError:
            print(current_date, 'missing data')
        else:
            dates.append(current_date)
            highs.append(high)
            lows.append(low)

#绘制图表.
fig = plt.figure(dpi=128, figsize=(10, 9))
plt.plot(dates, highs, c='red', alpha=0.5)
plt.plot(dates, lows, c='blue', alpha=0.5)
#facecolor指定了填充区域的颜色
plt.fill_between(dates, highs, lows, facecolor='blue', alpha=0.1)


title = "Daily high and low temperatures  CA"
plt.title(title, fontsize=10)
plt.xlabel('', fontsize=6)
fig.autofmt_xdate()
plt.ylabel("Temperature (F)", fontsize=6)
plt.tick_params(axis='both', which='major', labelsize=6)

plt.show()
