页面开启监听后 记得要销毁
案例: 我做了个 图表自适应
<template>
<div>
<a-row style="margin: 20px">
<a-col>
<div
id="container"
v-bind:style="{ size, height: height }"
></div>
</a-col>
</a-row>
<hr />
</div>
</template>
<script>
import echarts from "echarts";
export default {
props: {
datalist: {
type: Array,
},
},
data() {
return {
size: "110%",
height: "300px",
screenWidth: "",
screenHeight: "",
// charts: null
};
},
mounted() {
this.screenWidth = document.body.clientWidth;
this.screenHeight = document.body.clientHeight;
//这里是监控浏览器变大 或者 缩放 ,当有变化时,会触发showChart()函数里面的charts.resize();//重新适配大小
window.addEventListener(
"resize",
this.resizeFunc,
false
);
},
watch: {
datalist: function () {
this.showChart();
},
},
methods: {
resizeFunc () {
this.screenWidth = document.body.clientWidth;
this.screenHeight = document.body.clientHeight;
this.showChart();
},
showChart() {
// 基于准备好的dom,初始化echarts实例
var charts = echarts.init(document.getElementById("container"), "light");
// 指定图表的配置项和数据
var option = {
grid: {
// 控制图的大小,调整下面这些值就可以,
y: 40, //控制x轴文字与底部的距离
x: 30, //控制y轴文字与左边的距离
},
title: {
text: "本周新增用例数",
},
tooltip: {},
legend: {},
xAxis: {
//底部字横着放
axisLabel: {
margin: 10,
interval: 0, //横轴信息全部显示
rotate: -15, //-15度角倾斜显示
},
data: this.datalist[0],
},
yAxis: {
type: "value",
//控制y轴间隔单位
minInterval: 1,
},
series: [
{
name: "",
type: "bar",
data: this.datalist[1],
},
],
};
// 使用刚指定的配置项和数据显示图表。
charts.setOption(option);
charts.resize(); //重新适配大小
},
},
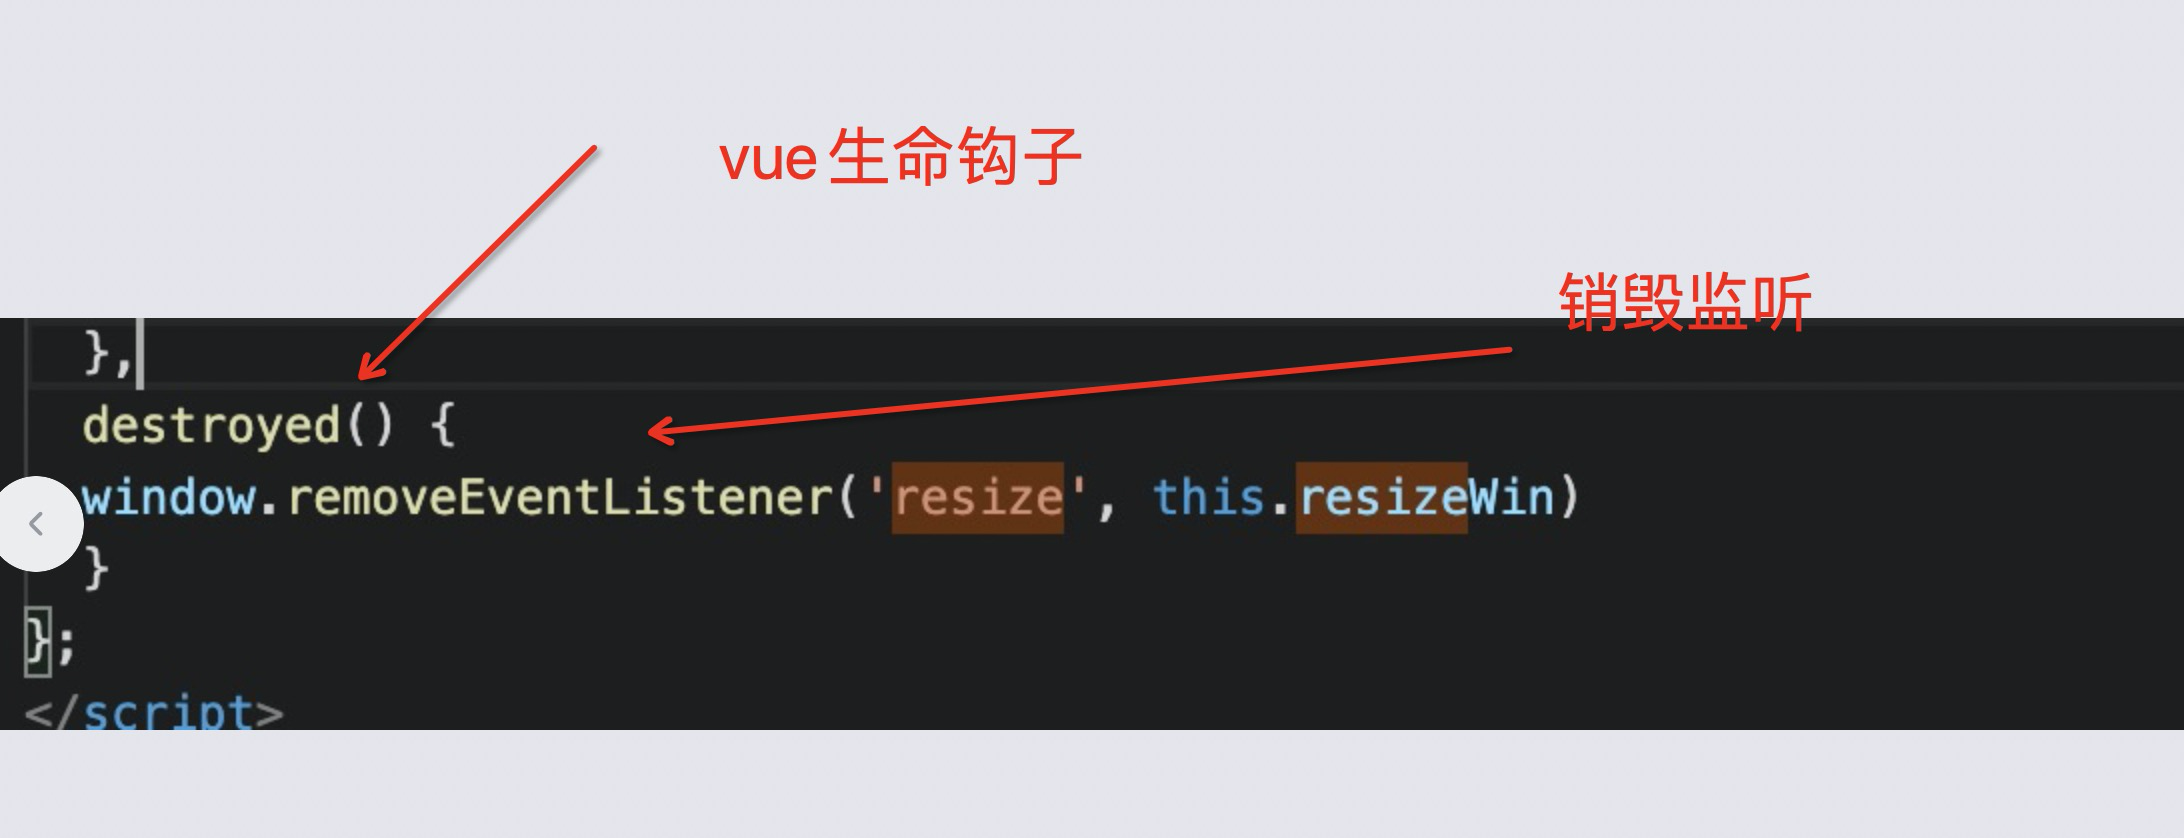
#离开页面销毁监听
destroyed() {
window.removeEventListener('resize', this.resizeFunc)
}
};
</script>
<style scoped>
</style>