Chapter 4 - Practical Data Visualization
Segment 4 - Creating labels and annotations
import numpy as np
import pandas as pd
from pandas import Series, DataFrame

import matplotlib.pyplot as plt
from pylab import rcParams
%matplotlib inline
rcParams['figure.figsize'] = 8,4
Labeling plot features
The functional method
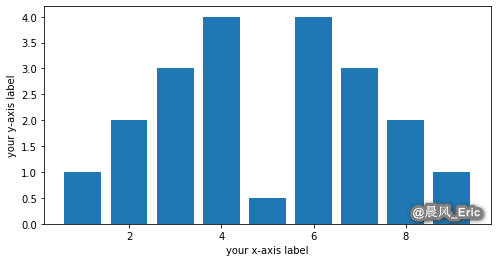
x = range(1,10)
y = [1,2,3,4,.5,4,3,2,1]
plt.bar(x,y)

plt.xlabel('your x-axis label')
plt.ylabel('your y-axis label')
Text(0, 0.5, 'your y-axis label')
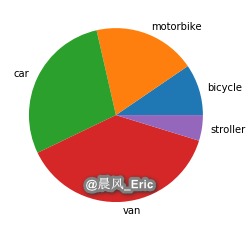
z = [1,2,3,4,.5]
veh_type = ['bicycle','motorbike','car','van','stroller']

plt.pie(z, labels=veh_type)
plt.show()
The object-oriented method
address = '~/Data/mtcars.csv'

cars = pd.read_csv(address)
cars.columns = ['car_names','mpg','cyl','disp', 'hp', 'drat', 'wt', 'qsec', 'vs', 'am', 'gear', 'carb']

mpg = cars.mpg

fig = plt.figure()
ax = fig.add_axes([.1,.1,1,1])

mpg.plot()

ax.set_xticks(range(32))

ax.set_xticklabels(cars.car_names, rotation=60, fontsize='medium')
ax.set_title('Miles per Gallon of Cars in mtcars Dataset')

ax.set_xlabel('car names')
ax.set_ylabel('miles/gal')
Text(0, 0.5, 'miles/gal')
Adding a legend to your plot
The functional method
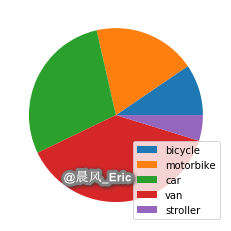
plt.pie(z)
plt.legend(veh_type, loc='best')
plt.show()
The object-oriented method
fig = plt.figure()
ax = fig.add_axes([.1,.1,1,1])

mpg.plot()

ax.set_xticks(range(32))

ax.set_xticklabels(cars.car_names, rotation=60, fontsize='medium')
ax.set_title('Miles per Gallon of Cars in mtcars Dataset')

ax.set_xlabel('car names')
ax.set_ylabel('miles/gal')

ax.legend(loc='best')
<matplotlib.legend.Legend at 0x7f21a56cc908>

Annotating your plot
mpg.max()
33.9
fig = plt.figure()
ax = fig.add_axes([.1,.1,1,1])

mpg.plot()

ax.set_xticks(range(32))

ax.set_xticklabels(cars.car_names, rotation=60, fontsize='medium')
ax.set_title('Miles per Gallon of Cars in mtcars Dataset')

ax.set_xlabel('car names')
ax.set_ylabel('miles/gal')

ax.legend(loc='best')

ax.set_ylim([0,45])
ax.annotate('Toyota Corolla', xy=(19,33.9),xytext=(21,35),
            arrowprops=dict(facecolor='black', shrink=0.05))
Text(21, 35, 'Toyota Corolla')