Chapter 4 - Practical Data Visualization
Segment 6 - Creating statistical data graphics
Statistical Plots Allow Viewers To:
- Identify outliers
- Visualize distributions
- Deduce variable types
- Discover relationships and core relations between variables in a dataset
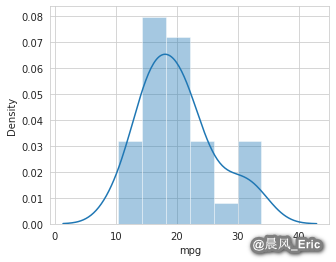
Histograms
A histogram shows a variable's distribution as a set of adjacent rectangles on a data chart. Histograms represent counts of data within a numerical range of values.
Scatterplots
Scatterplots are useful when you want to explore interrelations or dependencies between two different variables. These data graphics are ideal for visually spotting outliers and trends in data.
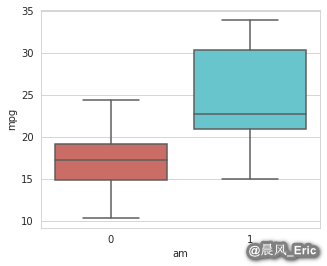
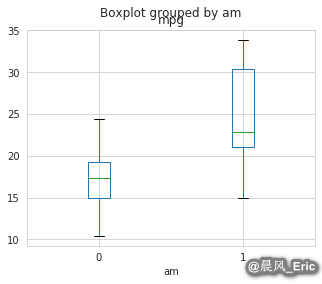
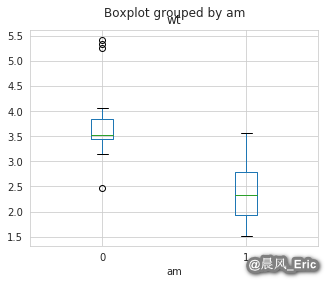
Boxplots
Boxplots are useful for seeing a variable's spread, and for detecting outliers.
import numpy as np
import pandas as pd
from pandas import Series, DataFrame

from pandas.plotting import scatter_matrix

import matplotlib.pyplot as plt
from pylab import rcParams
%matplotlib inline
rcParams['figure.figsize'] = 5, 4
import seaborn as sb
sb.set_style('whitegrid')
Eyeballing dataset distributions with histograms
address = '~/Data/mtcars.csv'

cars = pd.read_csv(address)

cars.columns = ['car_names','mpg','cyl','disp', 'hp', 'drat', 'wt', 'qsec', 'vs', 'am', 'gear', 'carb']
cars.index = cars.car_names
mpg = cars['mpg']
mpg.plot(kind='hist')
<matplotlib.axes._subplots.AxesSubplot at 0x7f637c0199b0>
plt.hist(mpg)
plt.plot()
[]
sb.distplot(mpg)
/home/ericwei/.local/lib/python3.7/site-packages/seaborn/distributions.py:2557: FutureWarning: `distplot` is a deprecated function and will be removed in a future version. Please adapt your code to use either `displot` (a figure-level function with similar flexibility) or `histplot` (an axes-level function for histograms).
  warnings.warn(msg, FutureWarning)
/usr/local/lib/python3.7/dist-packages/matplotlib/cbook/__init__.py:1402: FutureWarning: Support for multi-dimensional indexing (e.g. `obj[:, None]`) is deprecated and will be removed in a future version.  Convert to a numpy array before indexing instead.
  x[:, None]
/usr/local/lib/python3.7/dist-packages/matplotlib/axes/_base.py:276: FutureWarning: Support for multi-dimensional indexing (e.g. `obj[:, None]`) is deprecated and will be removed in a future version.  Convert to a numpy array before indexing instead.
  x = x[:, np.newaxis]
/usr/local/lib/python3.7/dist-packages/matplotlib/axes/_base.py:278: FutureWarning: Support for multi-dimensional indexing (e.g. `obj[:, None]`) is deprecated and will be removed in a future version.  Convert to a numpy array before indexing instead.
  y = y[:, np.newaxis]


<matplotlib.axes._subplots.AxesSubplot at 0x7f6379883160>
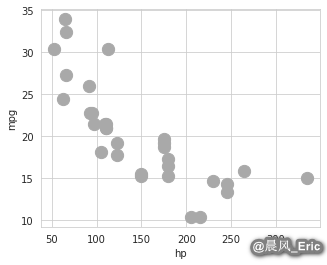
Seeing scatterplots in action
cars.plot(kind='scatter', x='hp', y='mpg', c=['darkgray'],s=150)
<matplotlib.axes._subplots.AxesSubplot at 0x7f637771e240>
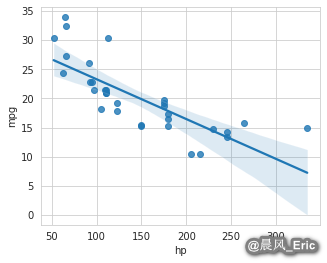
sb.regplot(x='hp', y='mpg', data=cars, scatter=True)
<matplotlib.axes._subplots.AxesSubplot at 0x7f6377688470>
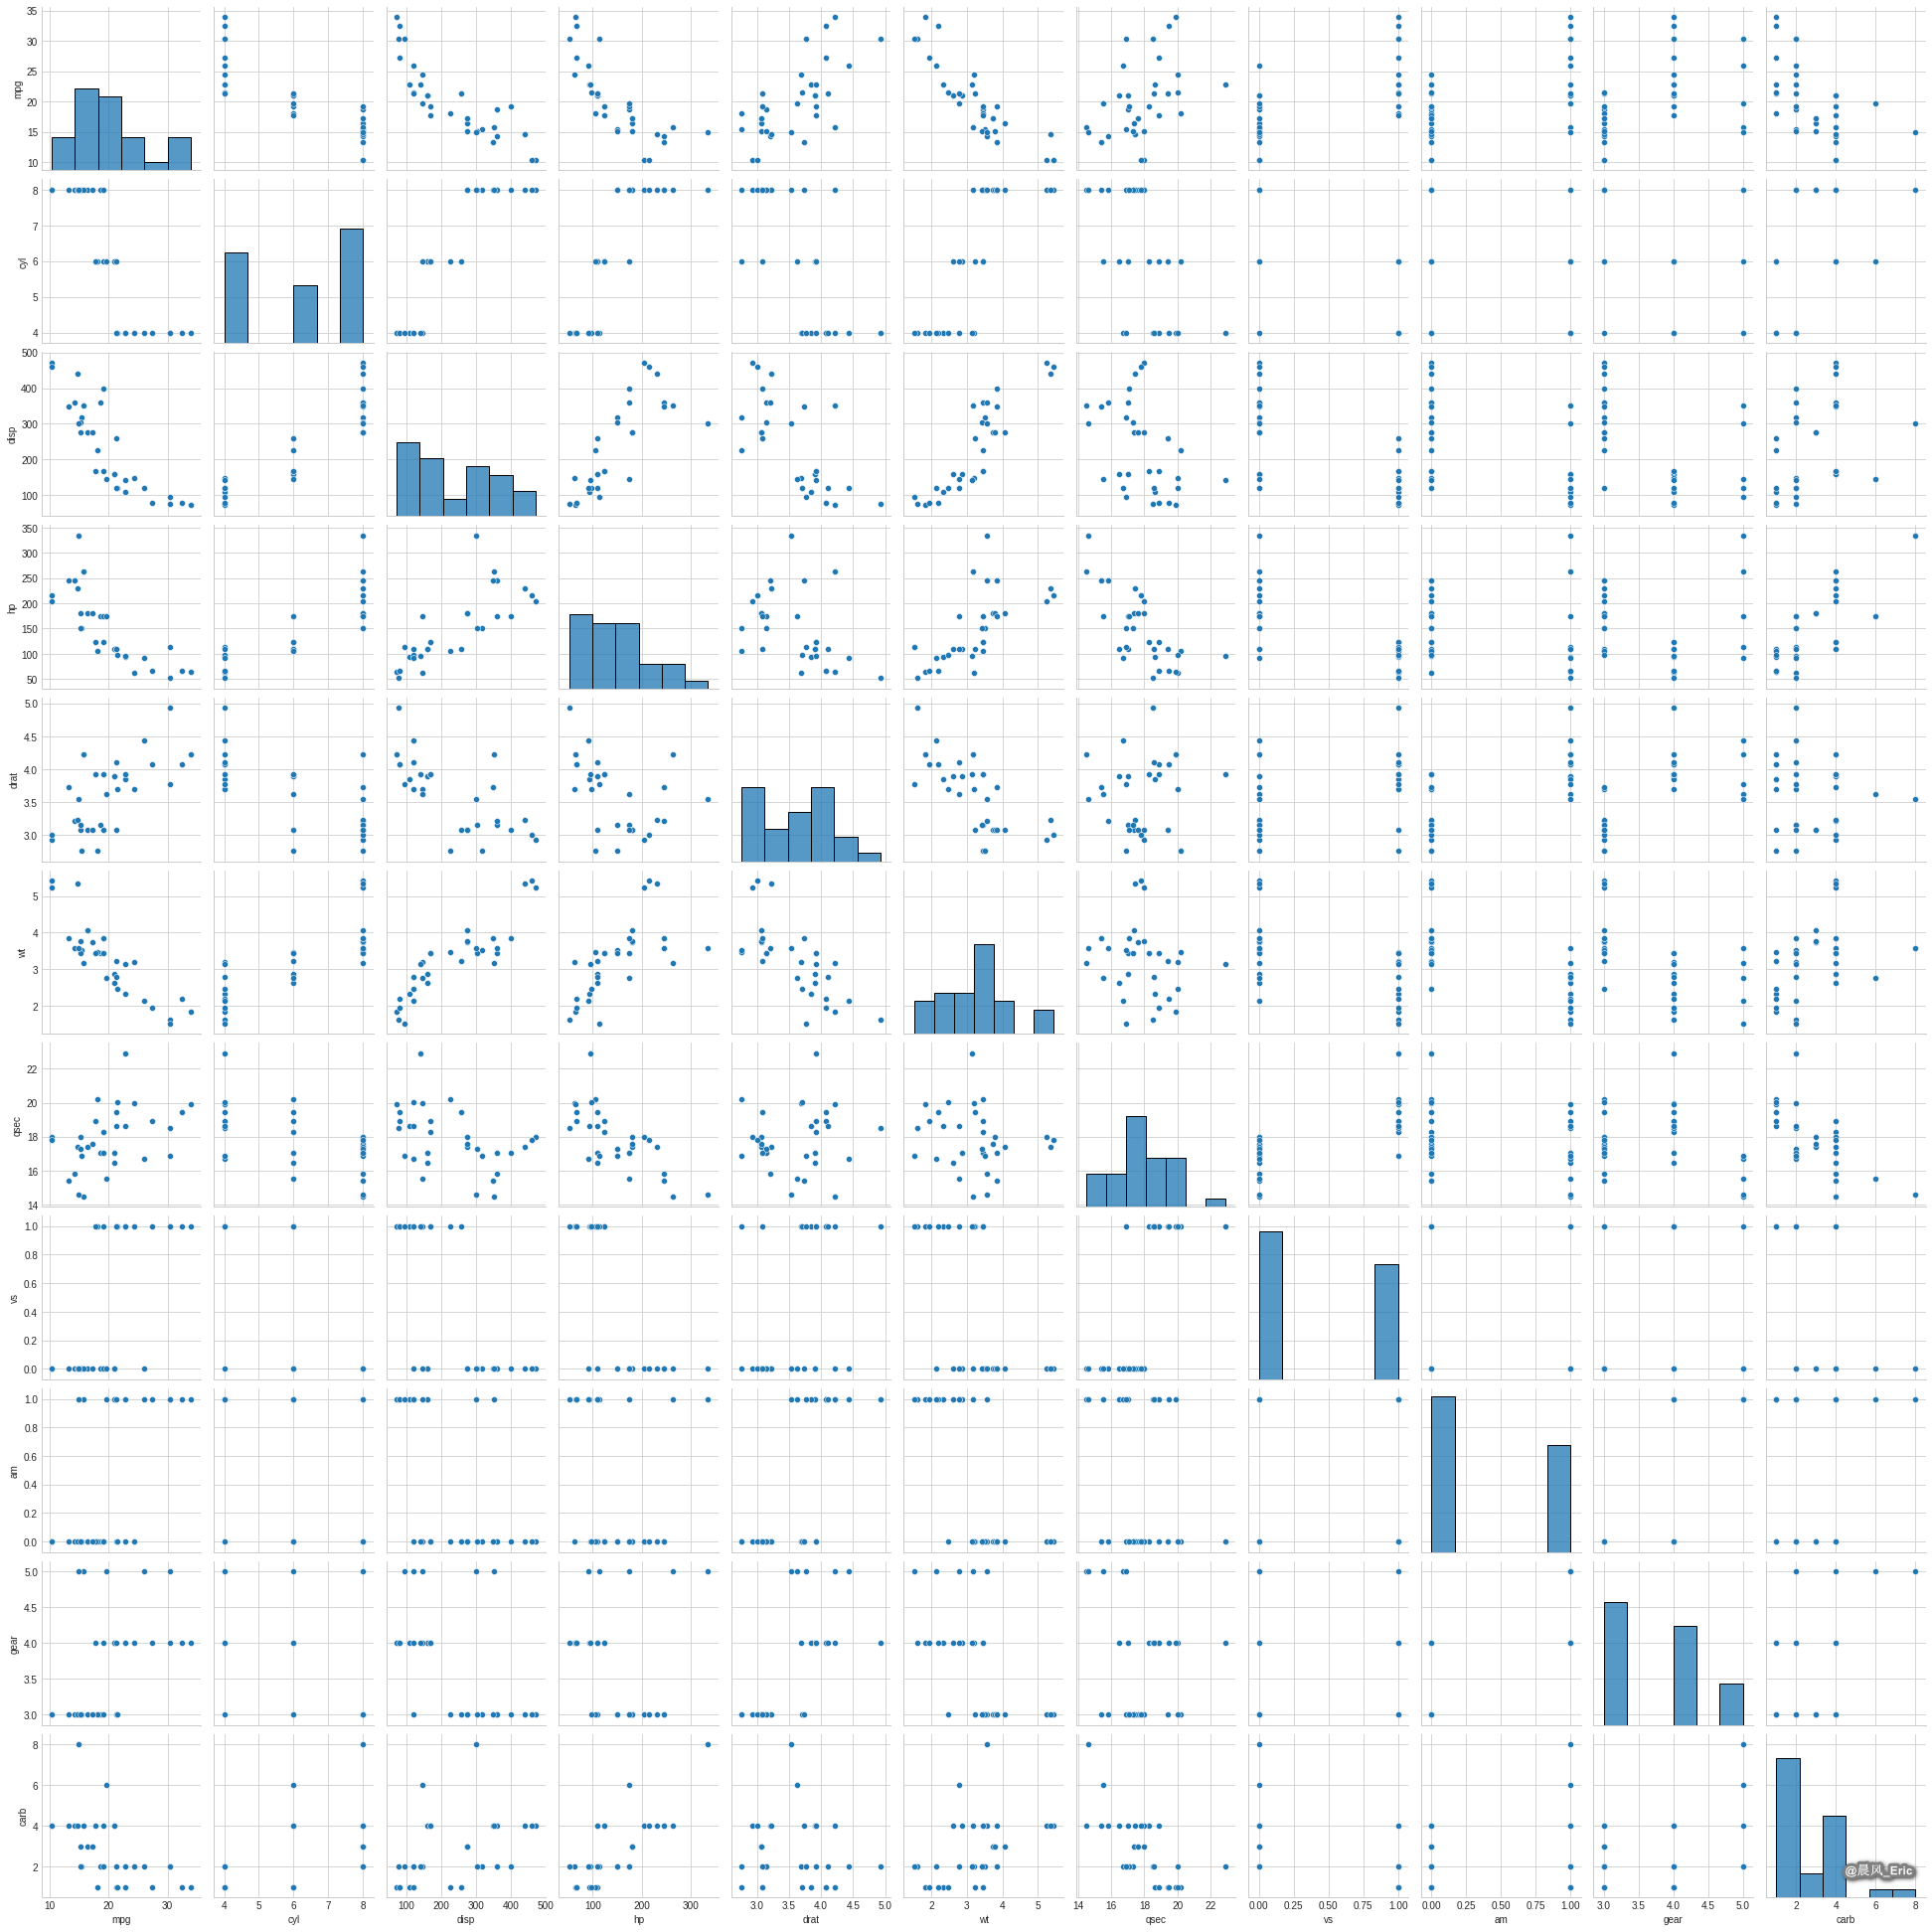
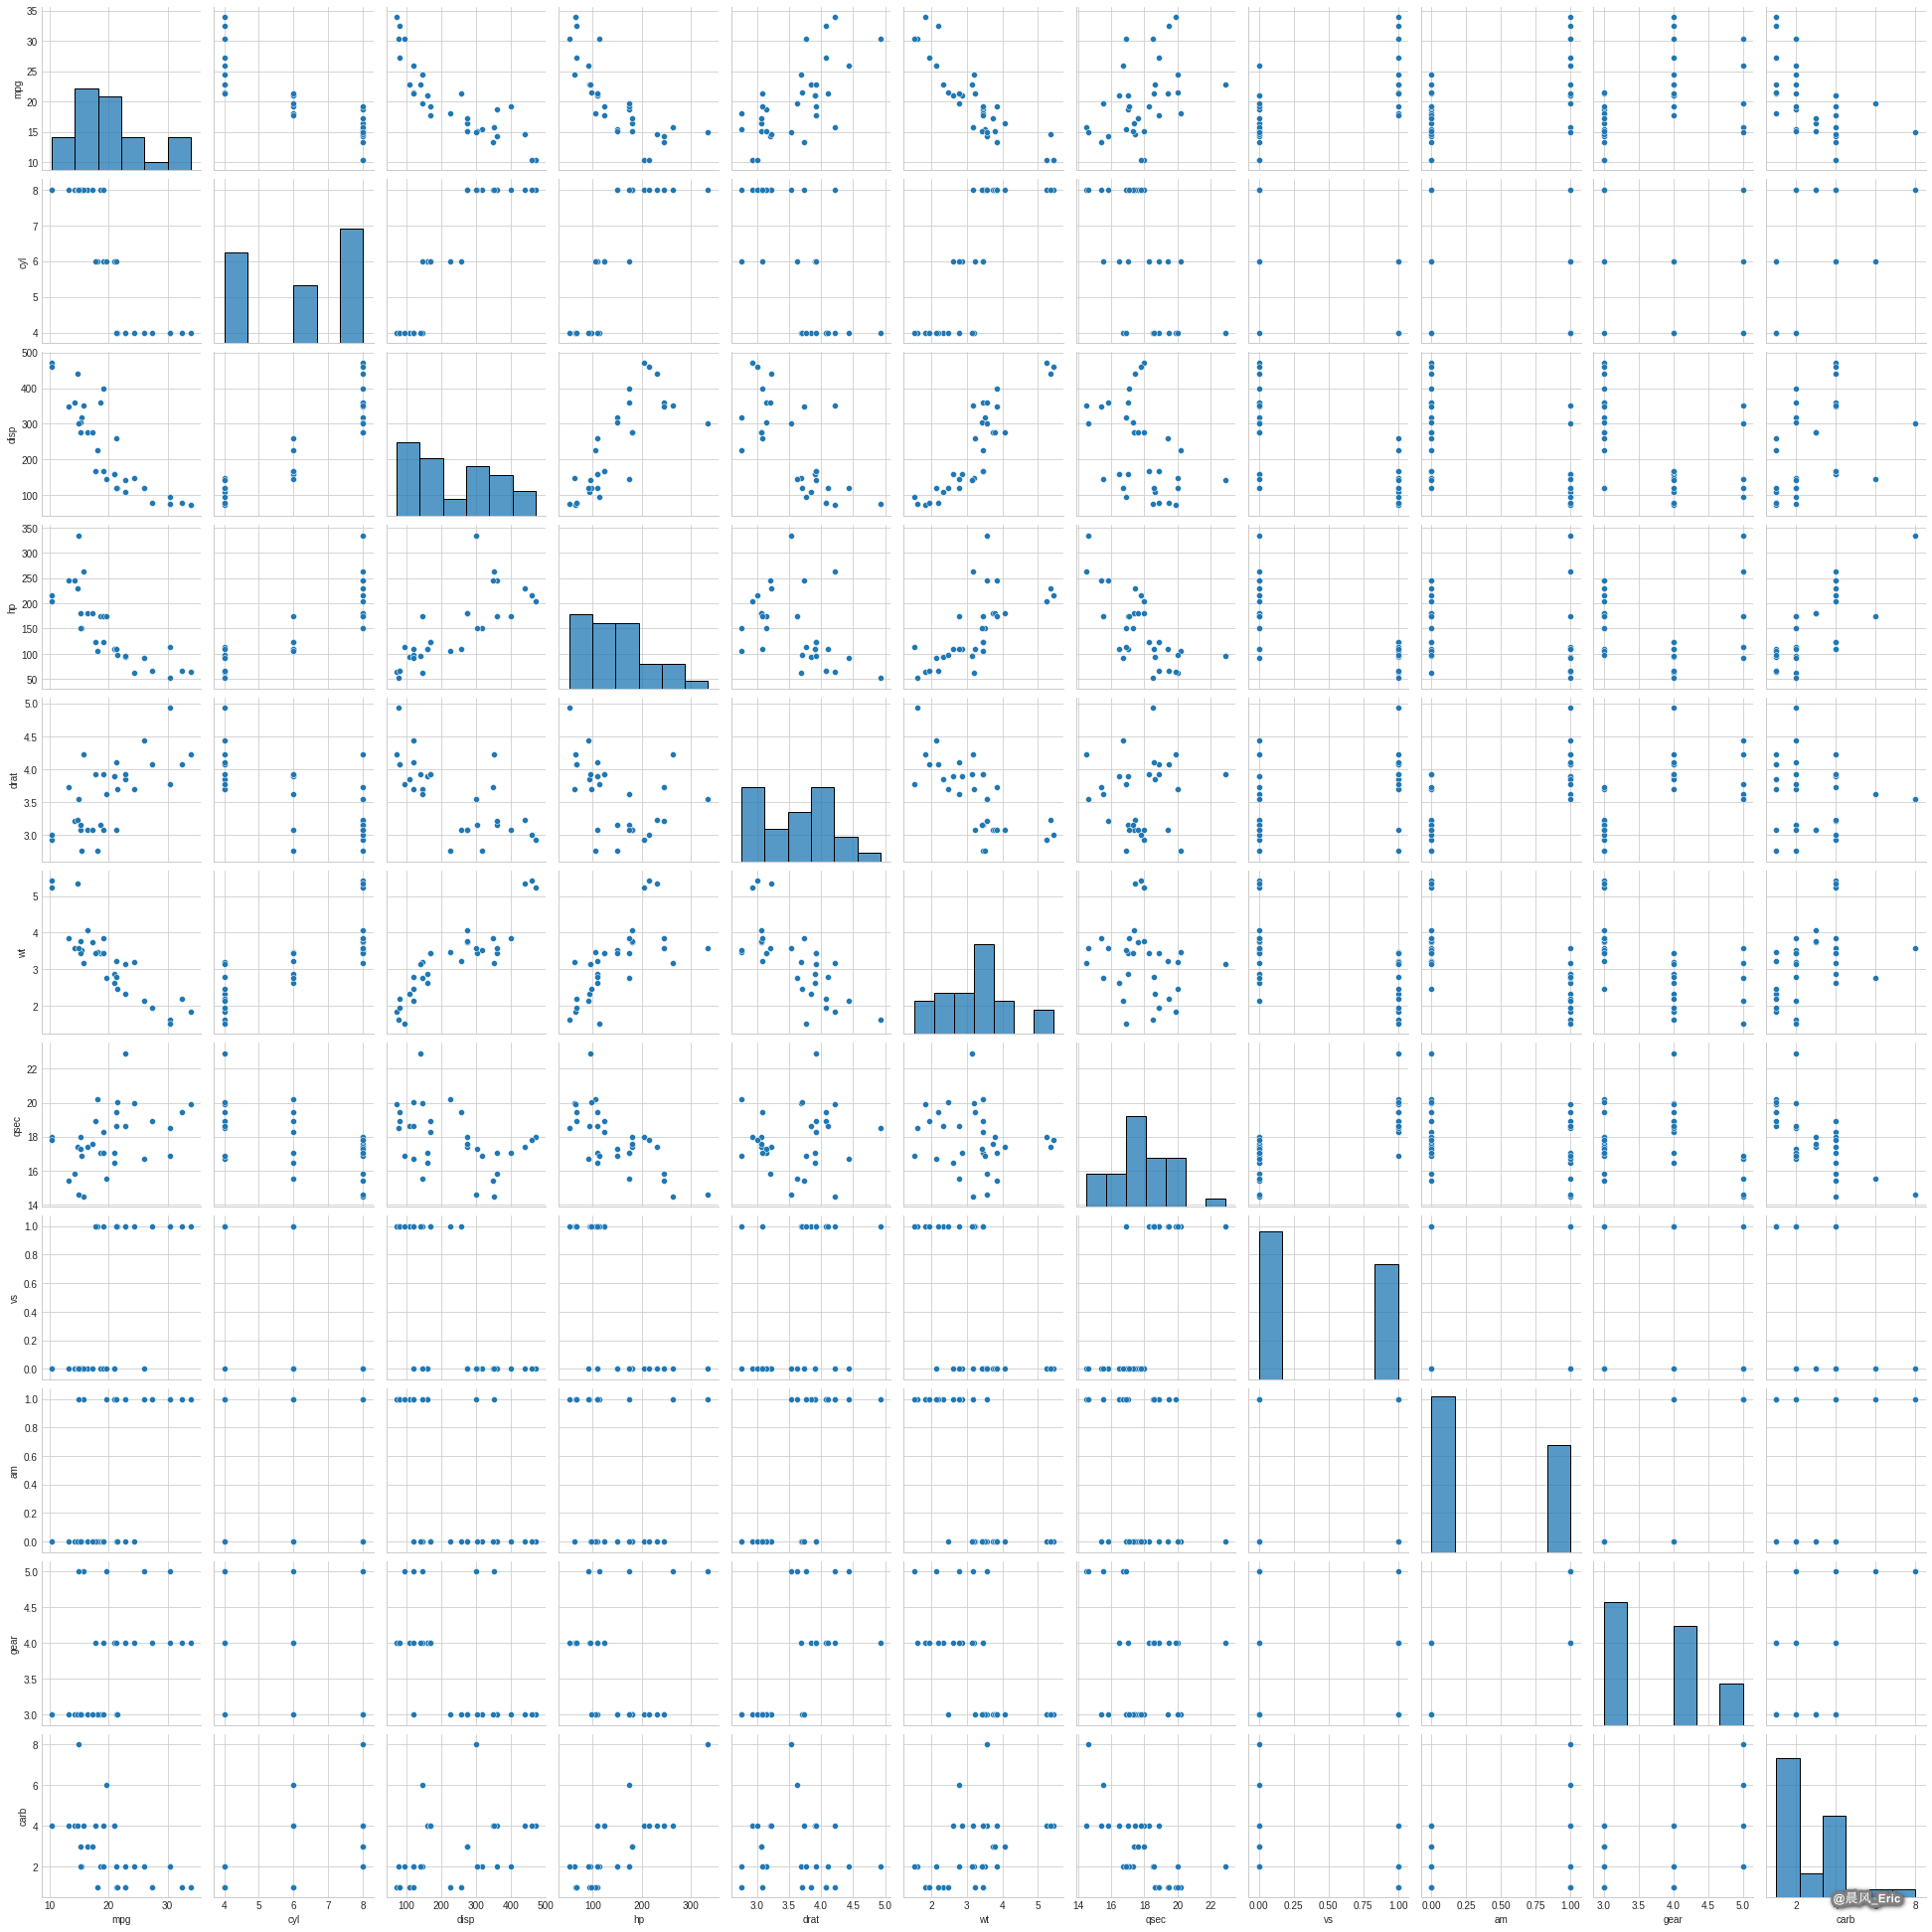
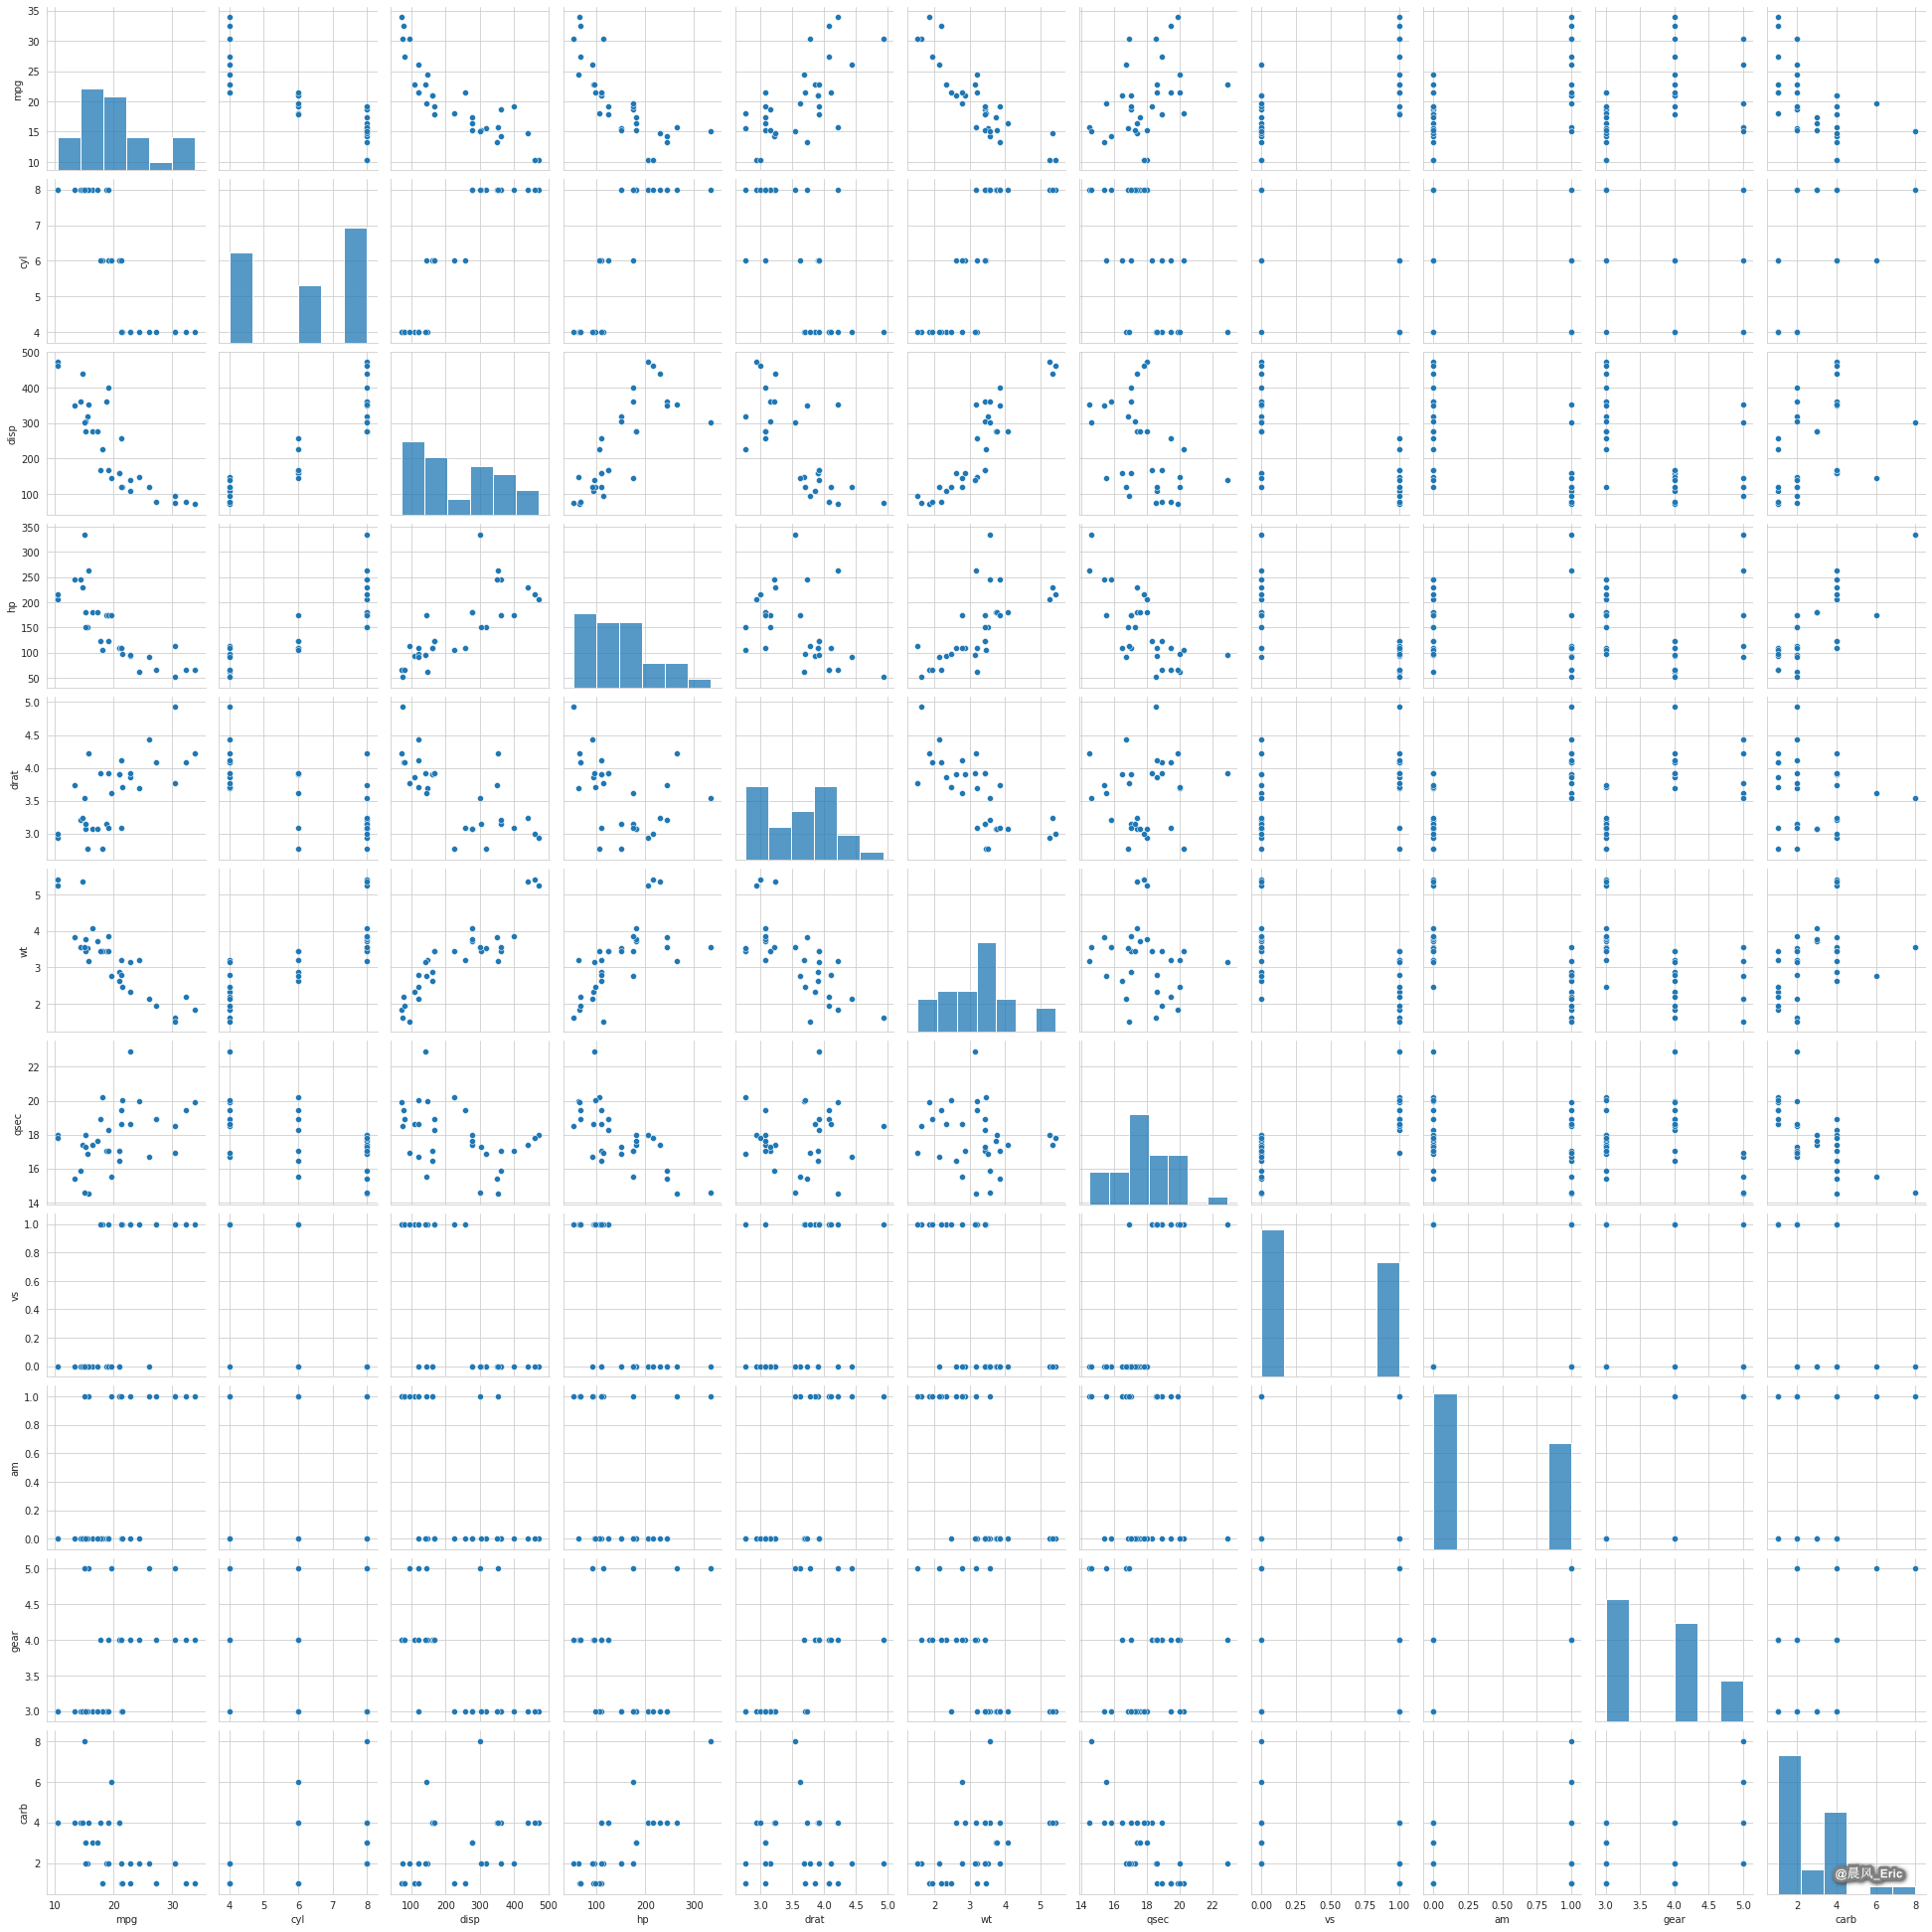
Generating a scatter plot matrix
sb.pairplot(cars)
<seaborn.axisgrid.PairGrid at 0x7f6373f31c88>
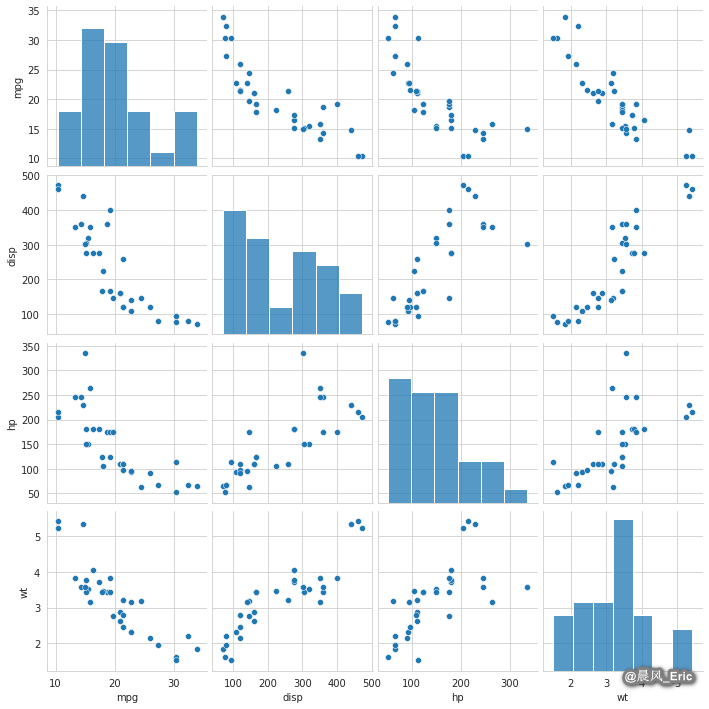
cars_subset = cars[['mpg','disp','hp','wt']]
sb.pairplot(cars_subset)
plt.show()
Building boxplots
cars.boxplot(column='mpg', by='am')
cars.boxplot(column='wt', by='am')
/home/ericwei/.local/lib/python3.7/site-packages/numpy/core/_asarray.py:83: VisibleDeprecationWarning: Creating an ndarray from ragged nested sequences (which is a list-or-tuple of lists-or-tuples-or ndarrays with different lengths or shapes) is deprecated. If you meant to do this, you must specify 'dtype=object' when creating the ndarray
  return array(a, dtype, copy=False, order=order)


<matplotlib.axes._subplots.AxesSubplot at 0x7f636875dc88>
sb.boxplot(x='am', y='mpg', data=cars, palette='hls')
<matplotlib.axes._subplots.AxesSubplot at 0x7f636836ae48>