Chapter 5 - Basic Math and Statistics
Segment 5 - Starting with parametric methods in pandas and scipy
import pandas as pd
import numpy as np

import matplotlib.pyplot as plt
import seaborn as sb
from pylab import rcParams

import scipy
from scipy.stats.stats import pearsonr
%matplotlib inline
rcParams['figure.figsize'] = 8,4
plt.style.use('seaborn-whitegrid')
The Pearson Correlation
address = '~/Data/mtcars.csv'

cars = pd.read_csv(address)
cars.columns = ['car_names','mpg','cyl','disp','hp','drat','wt','qsec','vs','am','gear','carb']
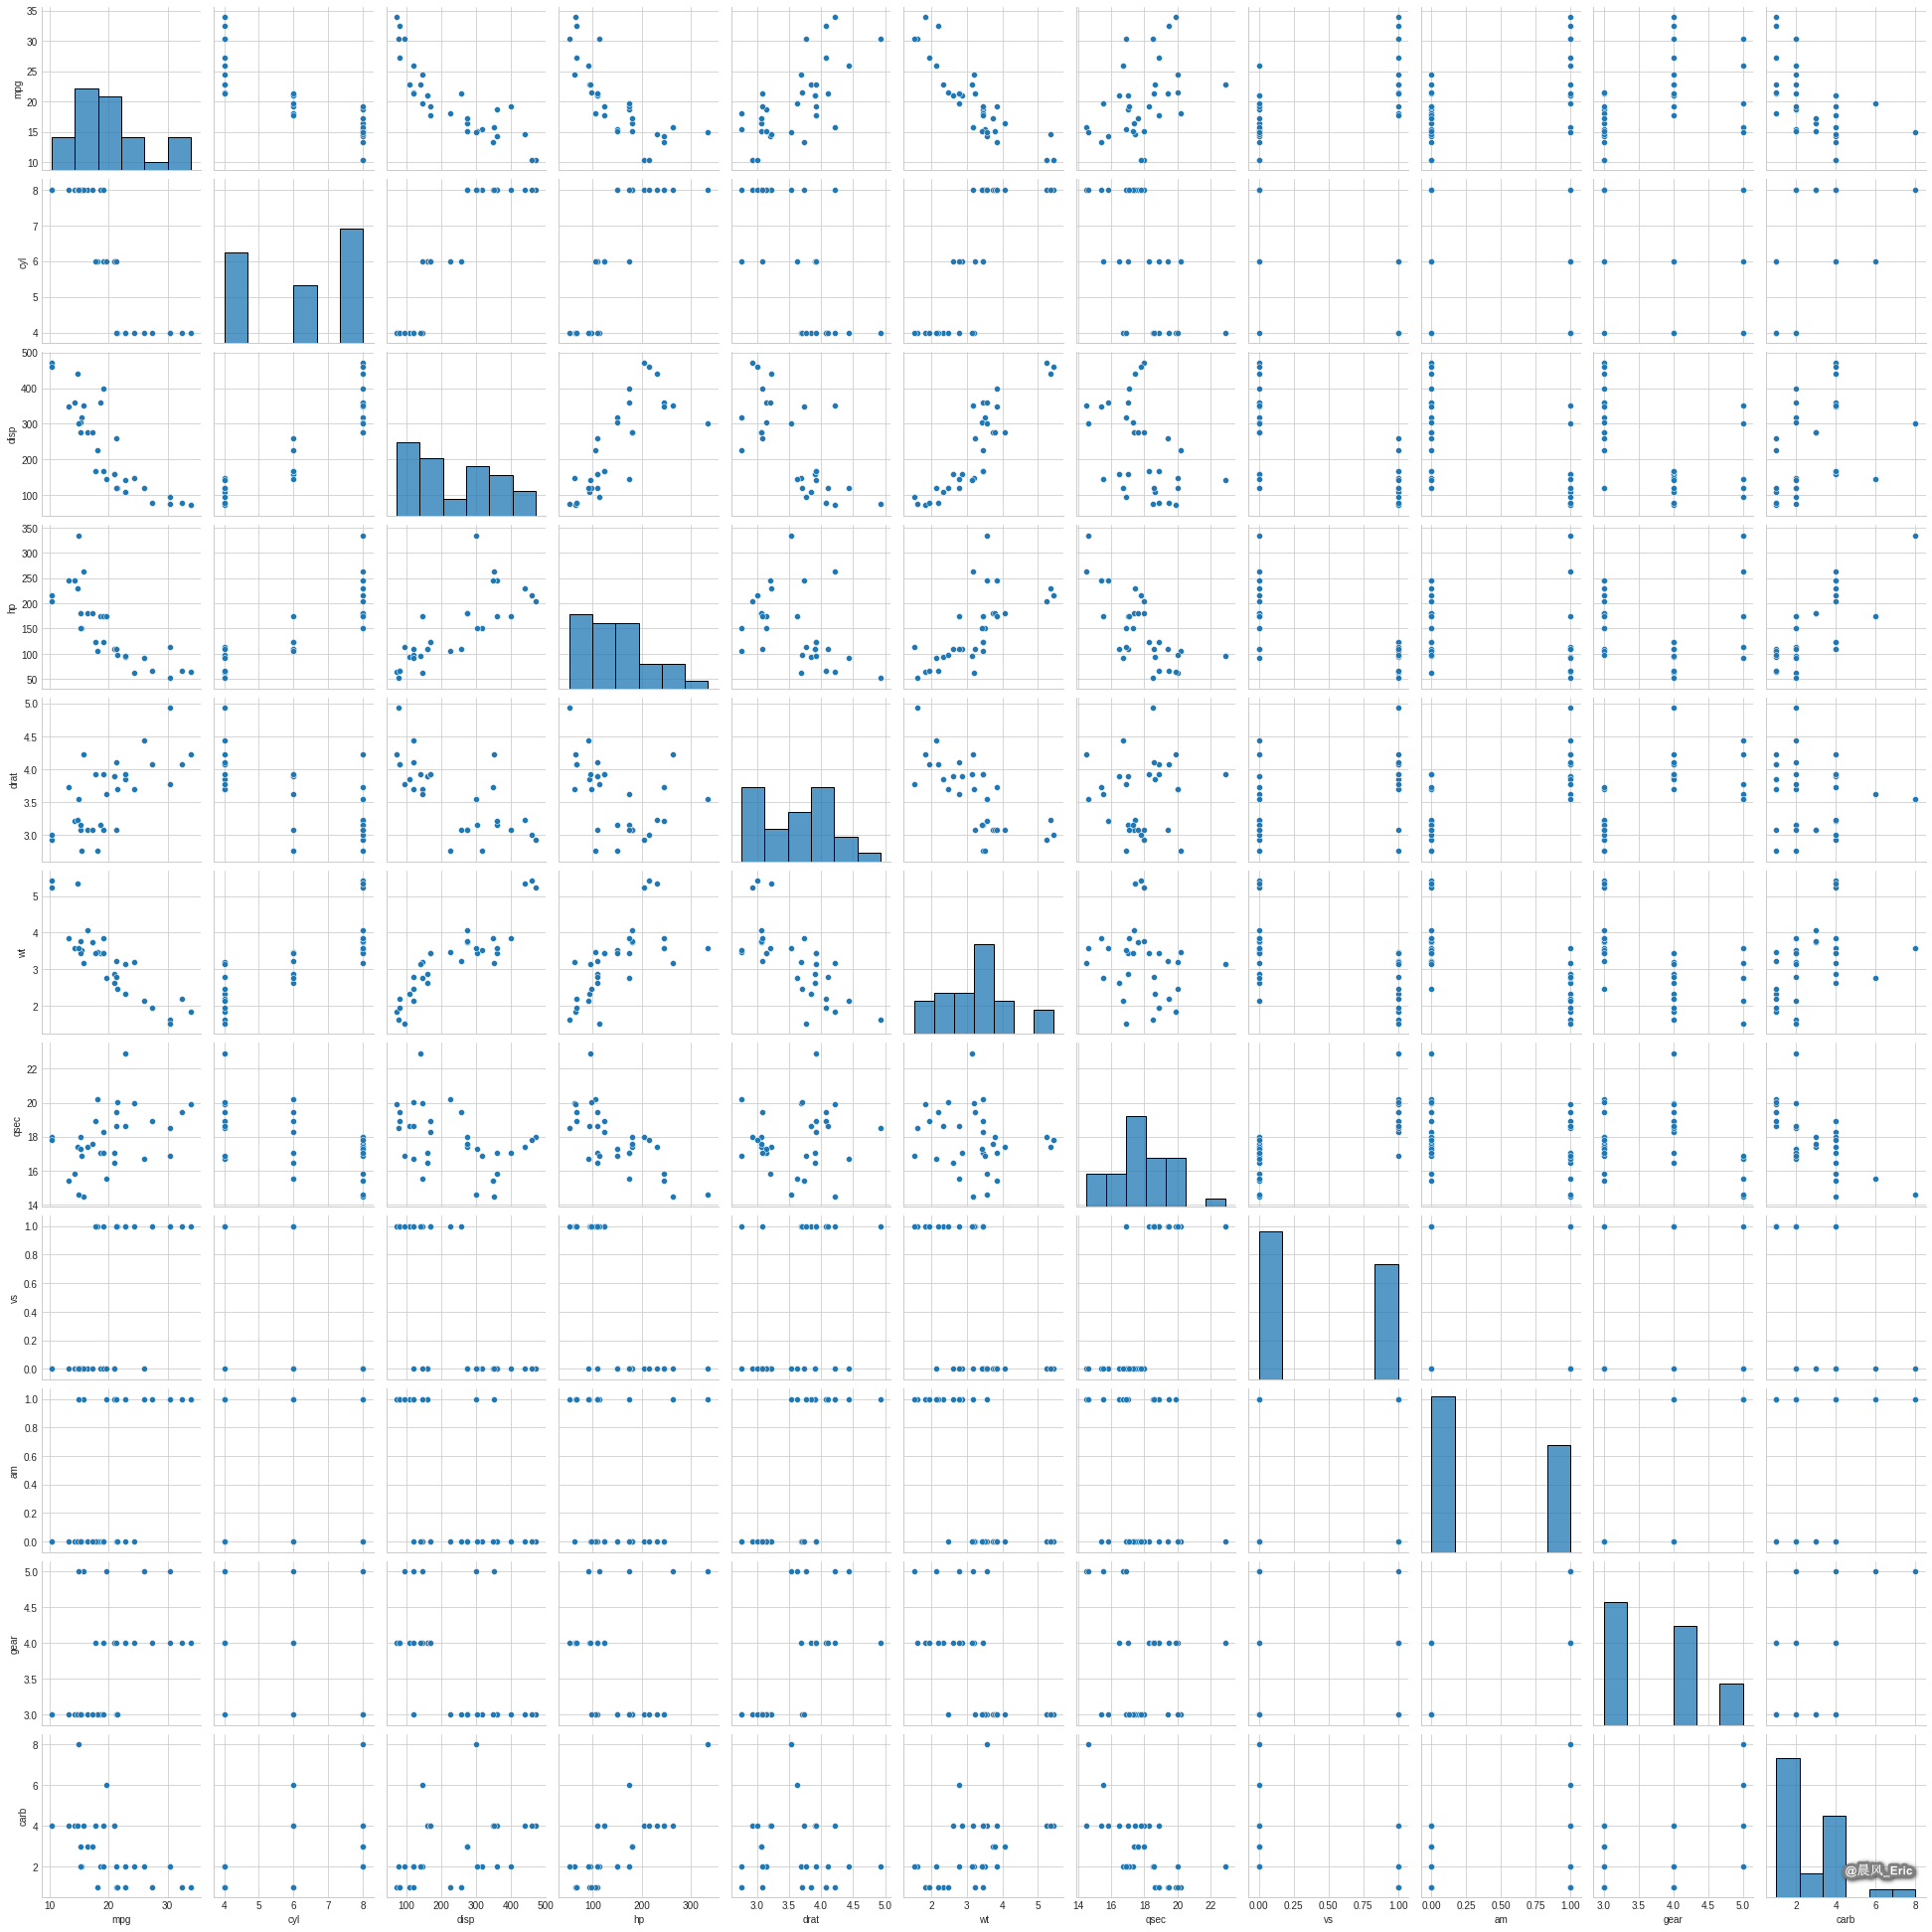
sb.pairplot(cars)
<seaborn.axisgrid.PairGrid at 0x7ff9164e46d8>
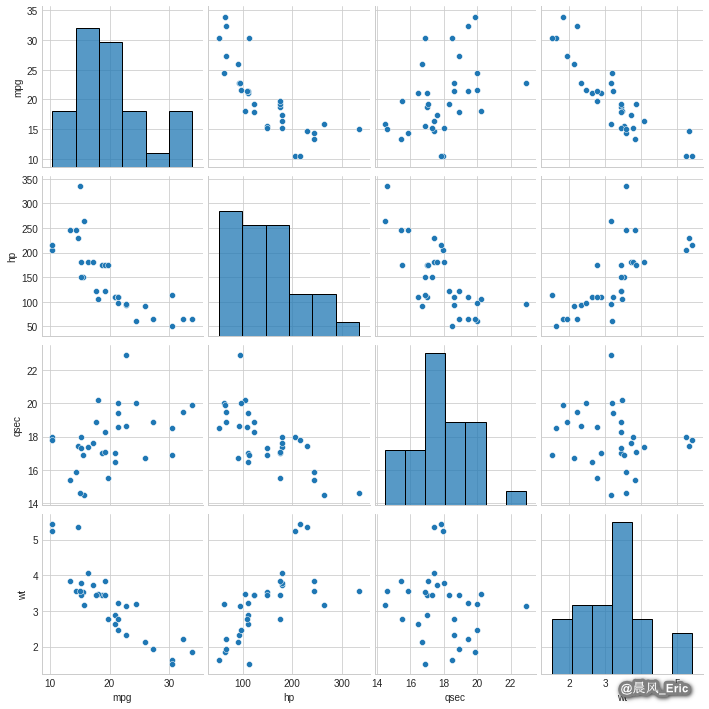
X = cars[['mpg','hp','qsec','wt']]
sb.pairplot(X)
<seaborn.axisgrid.PairGrid at 0x7ff91133c438>
Using scipy to calculate the Pearson correlation coefficient
mpg = cars['mpg']
hp = cars['hp']
qsec = cars['qsec']
wt = cars['wt']

pearsonr_coefficient, p_value = pearsonr(mpg, hp)
print('PeasonR Correlation Coefficient %0.3f'%(pearsonr_coefficient))
PeasonR Correlation Coefficient -0.776
pearsonr_coefficient, p_value = pearsonr(mpg, qsec)
print('PeasonR Correlation Coefficient %0.3f'%(pearsonr_coefficient))
PeasonR Correlation Coefficient 0.419
pearsonr_coefficient, p_value = pearsonr(mpg, wt)
print('PeasonR Correlation Coefficient %0.3f'%(pearsonr_coefficient))
PeasonR Correlation Coefficient -0.868
Using pandas to calculate the Pearson correlation coefficient
corr = X.corr()
corr
|
mpg |
hp |
qsec |
wt |
| mpg |
1.000000 |
-0.776168 |
0.418684 |
-0.867659 |
| hp |
-0.776168 |
1.000000 |
-0.708223 |
0.658748 |
| qsec |
0.418684 |
-0.708223 |
1.000000 |
-0.174716 |
| wt |
-0.867659 |
0.658748 |
-0.174716 |
1.000000 |
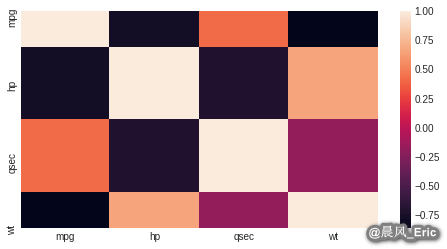
Using Seaborn to visualize the Pearson correlation coefficient
sb.heatmap(corr, xticklabels=corr.columns.values, yticklabels=corr.columns.values)
<matplotlib.axes._subplots.AxesSubplot at 0x7ff90c978358>