Chapter 5 - Basic Math and Statistics
import numpy as np
import pandas as pd
import scipy

import matplotlib.pyplot as plt
from matplotlib import rcParams
import seaborn as sb

import sklearn
from sklearn import preprocessing
from sklearn.preprocessing import scale
%matplotlib inline
rcParams['figure.figsize'] = 5, 4
sb.set_style('whitegrid')
address = '~/Data/mtcars.csv'

cars = pd.read_csv(address)
cars.columns = ['car_names','mpg','cyl','disp', 'hp', 'drat', 'wt', 'qsec', 'vs', 'am', 'gear', 'carb']
mpg = cars.mpg
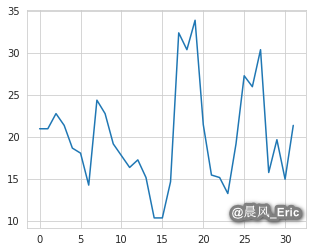
plt.plot(mpg)
[<matplotlib.lines.Line2D at 0x7f8460556b70>]
cars[['mpg']].describe()
|
mpg |
| count |
32.000000 |
| mean |
20.090625 |
| std |
6.026948 |
| min |
10.400000 |
| 25% |
15.425000 |
| 50% |
19.200000 |
| 75% |
22.800000 |
| max |
33.900000 |
mpg_matrix = mpg.values.reshape(-1,1)

scaled = preprocessing.MinMaxScaler()

scaled_mpg = scaled.fit_transform(mpg_matrix)
plt.plot(scaled_mpg)
[<matplotlib.lines.Line2D at 0x7f845fe54828>]
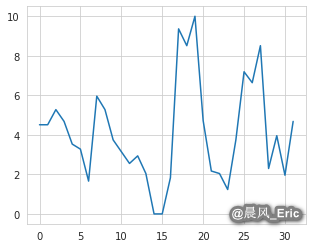
scaled = preprocessing.MinMaxScaler(feature_range=(0,10))

scaled_mpg = scaled.fit_transform(mpg_matrix)
plt.plot(scaled_mpg)
[<matplotlib.lines.Line2D at 0x7f845fdb8550>]
Using scale() to scale your features
standardized_mpg = scale(mpg, axis=0, with_mean=False, with_std=False)
plt.plot(standardized_mpg)
[<matplotlib.lines.Line2D at 0x7f845fd91be0>]
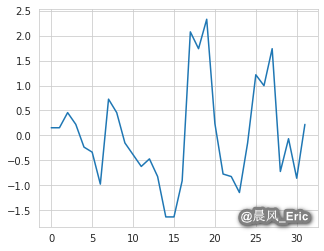
standardized_mpg = scale(mpg)
plt.plot(standardized_mpg)
[<matplotlib.lines.Line2D at 0x7f845fcf6470>]
