Chapter 3 - Regression Models
Segment 2 - Multiple linear regression
import numpy as np
import pandas as pd

import matplotlib.pyplot as plt
from pylab import rcParams

import sklearn
from sklearn.linear_model import LinearRegression
from sklearn.preprocessing import scale
%matplotlib inline
rcParams['figure.figsize'] = 5, 4
import seaborn as sb
sb.set_style('whitegrid')
from collections import Counter
(Multiple) linear regression on the enrollment data
address = '~/Data/enrollment_forecast.csv'

enroll = pd.read_csv(address)
enroll.columns = ['year', 'roll', 'unem', 'hgrad', 'inc']
enroll.head()
|
year |
roll |
unem |
hgrad |
inc |
| 0 |
1 |
5501 |
8.1 |
9552 |
1923 |
| 1 |
2 |
5945 |
7.0 |
9680 |
1961 |
| 2 |
3 |
6629 |
7.3 |
9731 |
1979 |
| 3 |
4 |
7556 |
7.5 |
11666 |
2030 |
| 4 |
5 |
8716 |
7.0 |
14675 |
2112 |
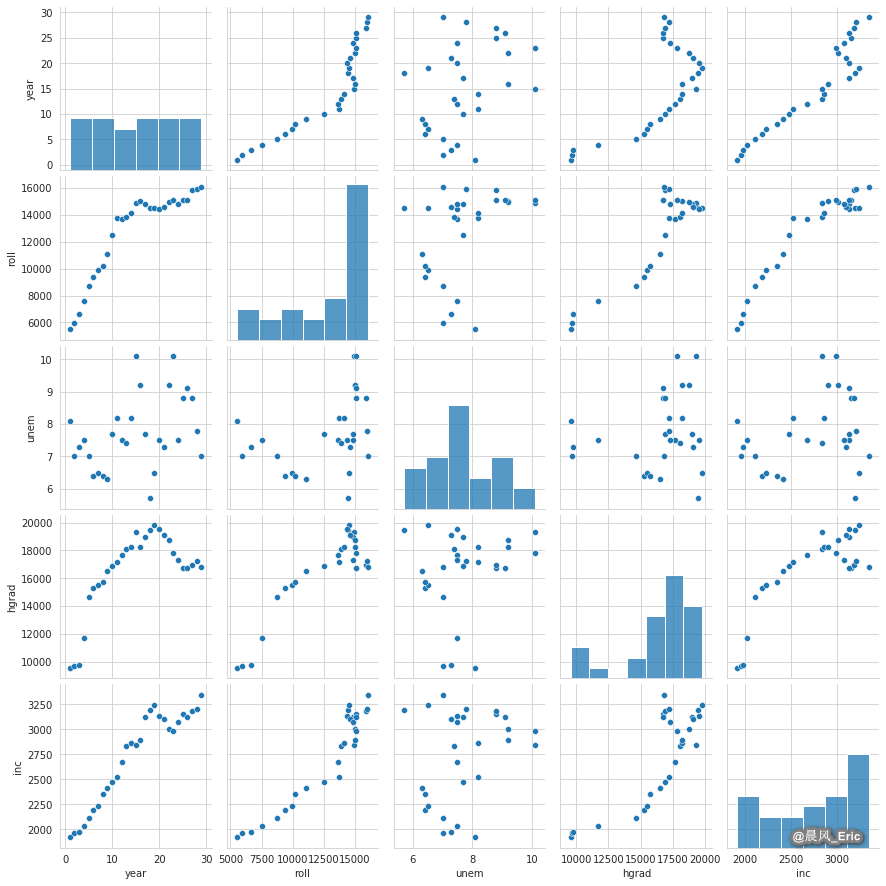
sb.pairplot(enroll)
<seaborn.axisgrid.PairGrid at 0x7f9c02deb7f0>
print(enroll.corr())
           year      roll      unem     hgrad       inc
year   1.000000  0.900934  0.378305  0.670300  0.944287
roll   0.900934  1.000000  0.391344  0.890294  0.949876
unem   0.378305  0.391344  1.000000  0.177376  0.282310
hgrad  0.670300  0.890294  0.177376  1.000000  0.820089
inc    0.944287  0.949876  0.282310  0.820089  1.000000
enroll_data = enroll[['unem', 'hgrad']].values

enroll_target = enroll[['roll']].values

enroll_data_names = ['unem', 'hgrad']

X, y = scale(enroll_data), enroll_target
Checking for missing values
missing_values = X==np.NAN
X[missing_values == True]
array([], dtype=float64)
LinReg = LinearRegression(normalize=True)

LinReg.fit(X, y)

print(LinReg.score(X, y))
0.8488812666133723