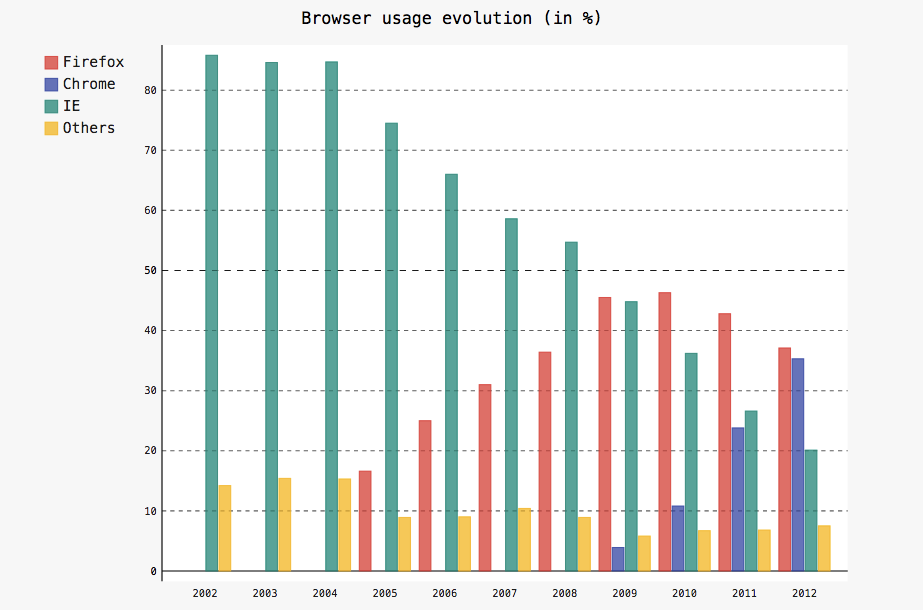
基本条形图:
import pygal

line_chart = pygal.Bar()
line_chart.title = 'Browser usage evolution (in %)'
line_chart.x_labels = map(str, range(2002, 2013))
line_chart.add('Firefox', [None, None, 0, 16.6,   25,   31, 36.4, 45.5, 46.3, 42.8, 37.1])
line_chart.add('Chrome',  [None, None, None, None, None, None,    0,  3.9, 10.8, 23.8, 35.3])
line_chart.add('IE',      [85.8, 84.6, 84.7, 74.5,   66, 58.6, 54.7, 44.8, 36.2, 26.6, 20.1])
line_chart.add('Others',  [14.2, 15.4, 15.3,  8.9,    9, 10.4,  8.9,  5.8,  6.7,  6.8,  7.5])
line_chart.render_to_file('bar_chart.svg')
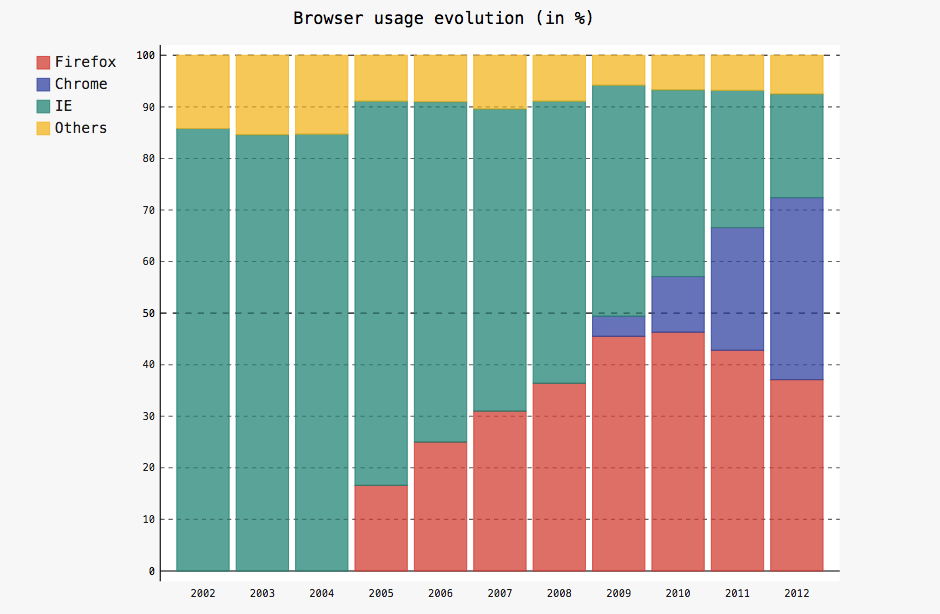
层叠条形图:
import pygal

line_chart = pygal.StackedBar()
line_chart.title = 'Browser usage evolution (in %)'
line_chart.x_labels = map(str, range(2002, 2013))
line_chart.add('Firefox', [None, None, 0, 16.6,   25,   31, 36.4, 45.5, 46.3, 42.8, 37.1])
line_chart.add('Chrome',  [None, None, None, None, None, None,    0,  3.9, 10.8, 23.8, 35.3])
line_chart.add('IE',      [85.8, 84.6, 84.7, 74.5,   66, 58.6, 54.7, 44.8, 36.2, 26.6, 20.1])
line_chart.add('Others',  [14.2, 15.4, 15.3,  8.9,    9, 10.4,  8.9,  5.8,  6.7,  6.8,  7.5])
line_chart.render_to_file('bar_chart.svg')
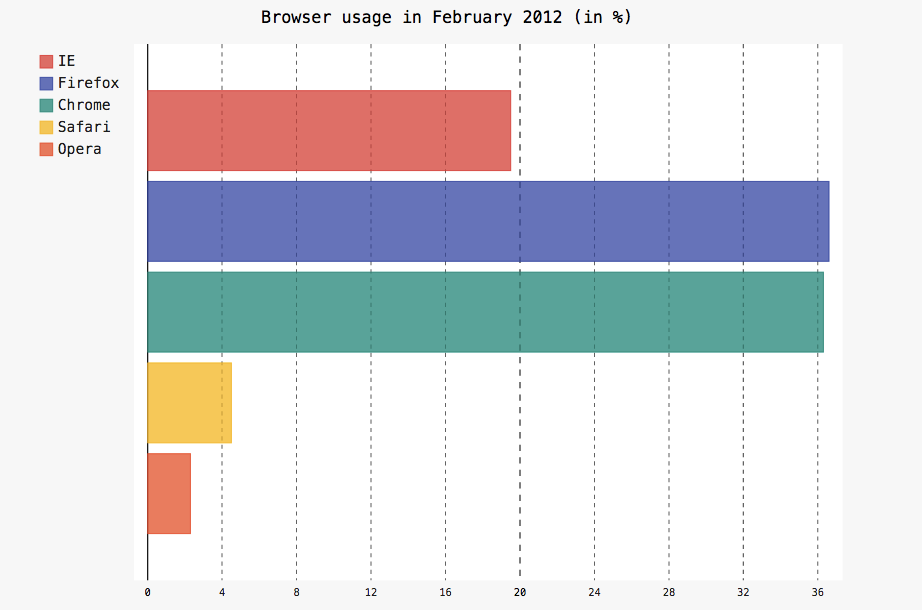
水平条形图:
import pygal
line_chart = pygal.HorizontalBar()
line_chart.title = 'Browser usage in February 2012 (in %)'
line_chart.add('IE', 19.5)
line_chart.add('Firefox', 36.6)
line_chart.add('Chrome', 36.3)
line_chart.add('Safari', 4.5)
line_chart.add('Opera', 2.3)
line_chart.render_to_file('bar_chart.svg')