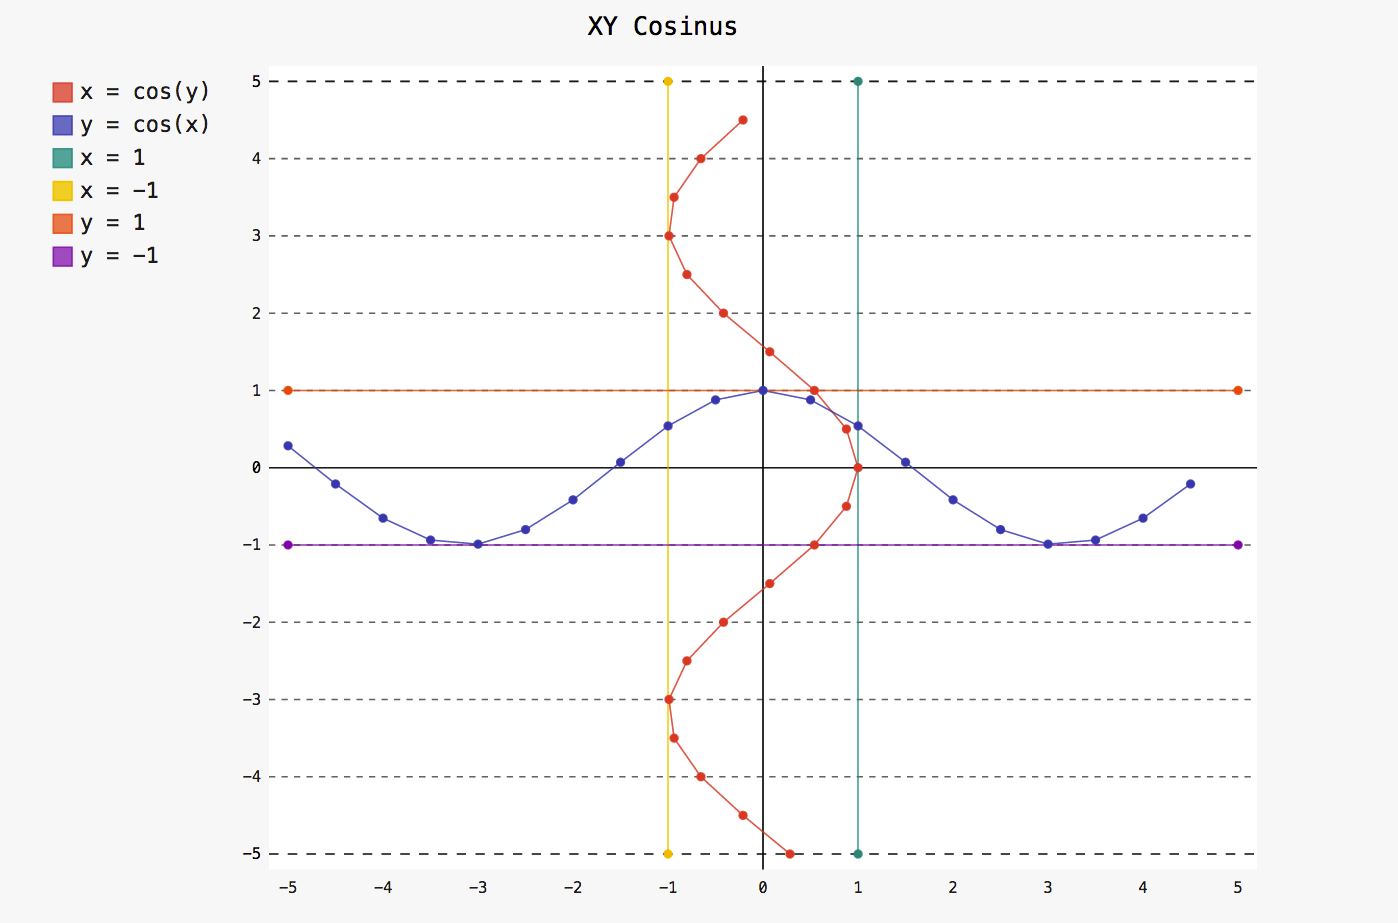
基本XY线:
import pygal
from math import cos

"""
XY线是将各个点用直线连接起来的折线图
需提供一个横纵坐标元组作为元素的列表
"""
xy_chart = pygal.XY()
xy_chart.title = 'XY Cosinus'
xy_chart.add('x = cos(y)', [(cos(x / 10.), x / 10.) for x in range(-50, 50, 5)])
xy_chart.add('y = cos(x)', [(x / 10., cos(x / 10.)) for x in range(-50, 50, 5)])
xy_chart.add('x = 1',  [(1, -5), (1, 5)])
xy_chart.add('x = -1', [(-1, -5), (-1, 5)])
xy_chart.add('y = 1',  [(-5, 1), (5, 1)])
xy_chart.add('y = -1', [(-5, -1), (5, -1)])
xy_chart.render_to_file('bar_chart.svg')
散点图:
import pygal

xy_chart = pygal.XY(stroke=False)
xy_chart.title = 'Correlation'
xy_chart.add('A', [(0, 0), (.1, .2), (.3, .1), (.5, 1), (.8, .6), (1, 1.08), (1.3, 1.1), (2, 3.23), (2.43, 2)])
xy_chart.add('B', [(.1, .15), (.12, .23), (.4, .3), (.6, .4), (.21, .21), (.5, .3), (.6, .8), (.7, .8)])
xy_chart.add('C', [(.05, .01), (.13, .02), (1.5, 1.7), (1.52, 1.6), (1.8, 1.63), (1.5, 1.82), (1.7, 1.23), (2.1, 2.23), (2.3, 1.98)])
xy_chart.render_to_file('bar_chart.svg')

日期:
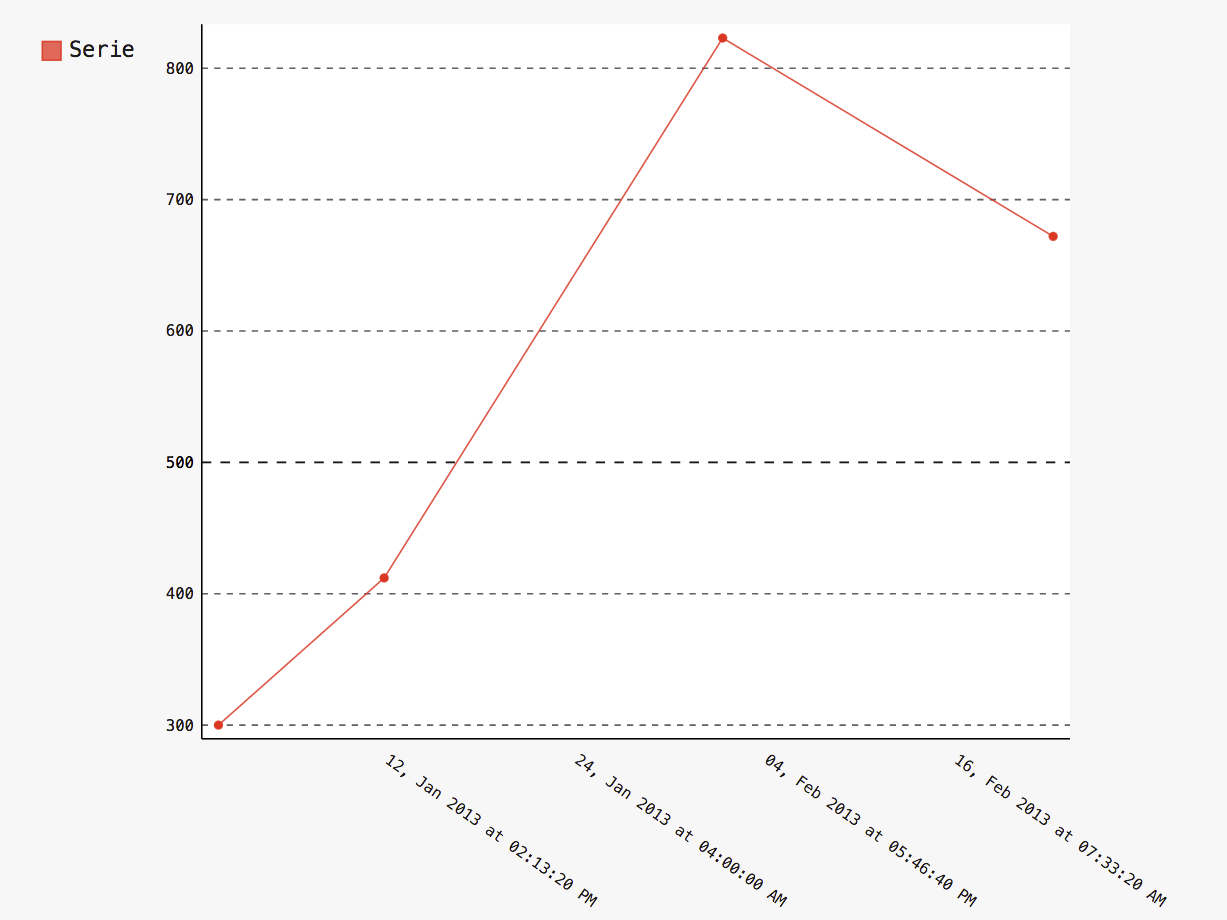
你可以使用日期模块绘制与日期有关的图表
DateTime
import pygal

from datetime import datetime
datetimeline = pygal.DateTimeLine(
    x_label_rotation=35, truncate_label=-1,
    x_value_formatter=lambda dt: dt.strftime('%d, %b %Y at %I:%M:%S %p'))
datetimeline.add("Serie", [
    (datetime(2013, 1, 2, 12, 0), 300),
    (datetime(2013, 1, 12, 14, 30, 45), 412),
    (datetime(2013, 2, 2, 6), 823),
    (datetime(2013, 2, 22, 9, 45), 672)
])
datetimeline.render_to_file('bar_chart.svg')
Date
import pygal

from datetime import date
dateline = pygal.DateLine(x_label_rotation=25)
dateline.x_labels = [
    date(2013, 1, 1),
    date(2013, 7, 1),
    date(2014, 1, 1),
    date(2014, 7, 1),
    date(2015, 1, 1),
    date(2015, 7, 1)
]
dateline.add("Serie", [
    (date(2013, 1, 2), 213),
    (date(2013, 8, 2), 281),
    (date(2014, 12, 7), 198),
    (date(2015, 3, 21), 120)
])
dateline.render_to_file('bar_chart.svg')

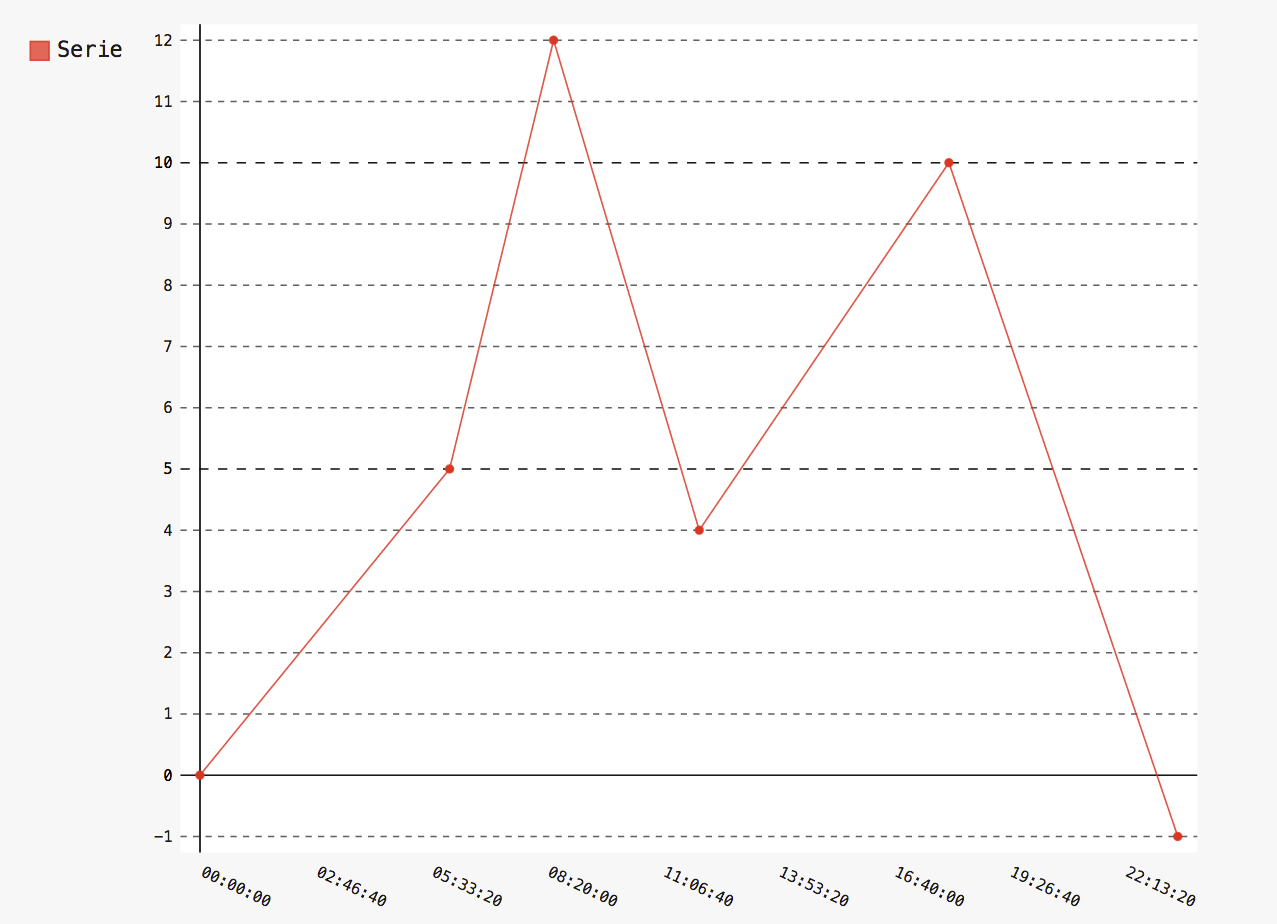
Time
import pygal
from datetime import time

dateline = pygal.TimeLine(x_label_rotation=25)
dateline.add("Serie", [
    (time(), 0),
    (time(6), 5),
    (time(8, 30), 12),
    (time(11, 59, 59), 4),
    (time(18), 10),
    (time(23, 30), -1),
])
dateline.render_to_file('bar_chart.svg')
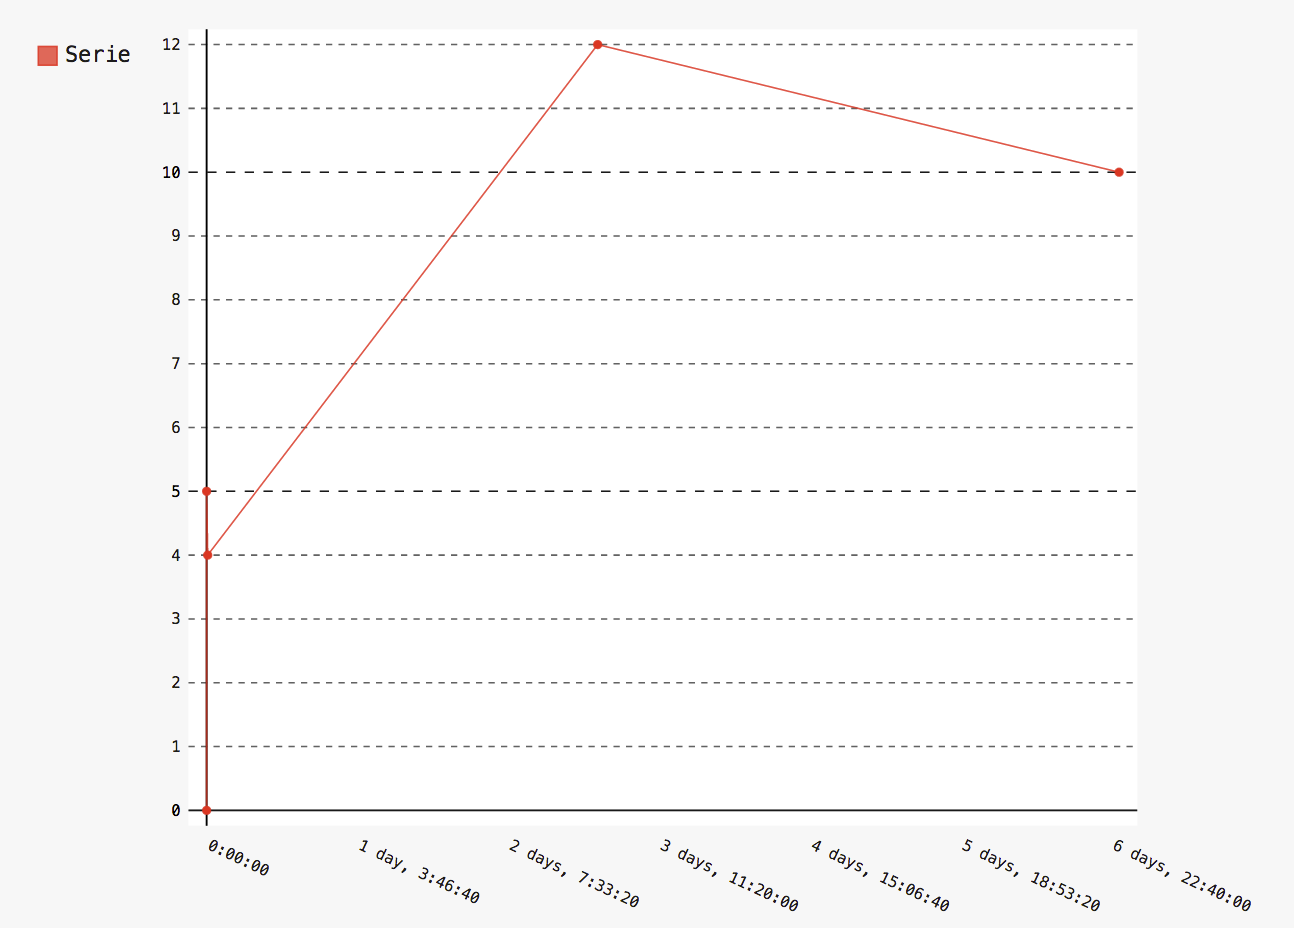
TimeDelta
import pygal
from datetime import timedelta

dateline = pygal.TimeDeltaLine(x_label_rotation=25)
dateline.add("Serie", [
  (timedelta(), 0),
  (timedelta(seconds=6), 5),
  (timedelta(minutes=11, seconds=59), 4),
  (timedelta(days=3, microseconds=30), 12),
  (timedelta(weeks=1), 10),
])
dateline.render_to_file('bar_chart.svg')