Zabbix3.0 Server以后就自带了MySQL插件来监控mysql数据库的模板,只需要配置好agent客户端,然后在web端给主机增加模板就行了。
以下是公司线上的zabbix3.0环境下添加mysql监控操作记录:
Zabbix_agent客户端操作
1)首先在客户端的mysql里添加权限,即本机使用zabbix账号连接本地的mysql
mysql> grant all on *.* to zabbix@'localhost' identified by "123456”;
mysql> flush privileges;
2)在zabbix_agent服务目录下创建.my.cnf 连接文件
线上的zabbix安装目录是/usr/local/zabbix
[root@ff_db_master1 ~]# cd /usr/local/zabbix/etc/
[root@ff_db_master1 etc]# cat .my.cnf
[client]
user=zabbix
password=123456
--------------------------------------------------------------------------------------------------------------
注意:
如果在数据库grant授权时,针对的是localhost,这个.my.cnf里面就不用加host参数了【如上配置】
但如果grant授权时针对的是本机的ip(如192.168.1.25),那么在.my.cnf文件里就要加上host参数进行指定了
即在.my.cnf文件就要加上:
[client]
host=192.168.1.25
socket=/Data/app/mysql5.6.25/var/mysql.sock 【这一行可以不用加上,默认会找到的】
user=zabbix
password=123456
--------------------------------------------------------------------------------------------------------------
3)配置MySQL的key文件
这个可以从zabbix3.0安装时的解压包里拷贝过来
(线上的是从zabbix_server服务端安装时解压目录/usr/local/src/zabbix3.0.3/conf/zabbix_agentd/userparameter_mysql.conf 拷贝到zabbix_agent客户端上的/usr/local/zabbix/etc/zabbix_agentd.conf.d/ 目录下的)
[root@ff_db_master1 zabbix_agentd.conf.d]# pwd
/usr/local/zabbix/etc/zabbix_agentd.conf.d
[root@ff_db_master1 zabbix_agentd.conf.d]# ls userparameter_mysql.conf
userparameter_mysql.conf
然后查看 userparameter_mysql.conf 文件,看到类似 HOME=/var/lib/zabbix 的路径设置,把路径全都替换为 /usr/local/zabbix/etc/,也就是上面的.my.cnf文件所在的目录路径。
另外,注意userparameter_mysql.conf 文件里的mysql命令路径(提前做好mysql的系统环境变量,以防mysql命令不被系统识别)
如下:
[root@ff_db_master1 zabbix_agentd.conf.d]# cat userparameter_mysql.conf
# For all the following commands HOME should be set to the directory that has .my.cnf file with password information.
# Flexible parameter to grab global variables. On the frontend side, use keys like mysql.status[Com_insert].
# Key syntax is mysql.status[variable].
UserParameter=mysql.status[*],echo "show global status where Variable_name='$1';" | HOME=/usr/local/zabbix/etc/ mysql -N | awk '{print $$2}'
# Flexible parameter to determine database or table size. On the frontend side, use keys like mysql.size[zabbix,history,data].
# Key syntax is mysql.size[<database>,<table>,<type>].
# Database may be a database name or "all". Default is "all".
# Table may be a table name or "all". Default is "all".
# Type may be "data", "index", "free" or "both". Both is a sum of data and index. Default is "both".
# Database is mandatory if a table is specified. Type may be specified always.
# Returns value in bytes.
# 'sum' on data_length or index_length alone needed when we are getting this information for whole database instead of a single table
UserParameter=mysql.size[*],bash -c 'echo "select sum($(case "$3" in both|"") echo "data_length+index_length";; data|index) echo "$3_length";; free) echo "data_free";; esac)) from information_schema.tables$([[ "$1" = "all" || ! "$1" ]] || echo " where table_schema="$1"")$([[ "$2" = "all" || ! "$2" ]] || echo "and table_name="$2"");" | HOME=/usr/local/zabbix/etc/ mysql -N'
UserParameter=mysql.ping,HOME=/usr/local/zabbix/etc/ mysqladmin ping | grep -c alive
UserParameter=mysql.version,mysql -V
4)按照上面修改完之后检查一下,然后重启zabbix_agent
[root@ff_db_master1 ~]# pkill -9 zabbix_agent
[root@ff_db_master1 ~]# /usr/local/zabbix/sbin/zabbix_agentd
接着在zabbix_server服务端进行命令行测试[下面的192.168.1.25是客户端的ip]
[root@Zabbix-server ~]# /usr/local/zabbix/bin/zabbix_get -s 192.168.1.25 -p 10050 -k "mysql.status[Uptime]"
12085434
[root@Zabbix-server ~]#
如果出现类似这一串key的数字,就说明配置ok,服务端能监控到客户端的mysql数据了!
成功啦,之后在监控界面增加主机对应的MySQL模板就ok了。 (上面命令中的-k后面添加的是键值,这个在zabbix界面里对应模块里可以找到。比如在某主机的"主动发现"规则里就能看到键值)
5)登录zabbix监控界面,在“配置”-“模板”里可以看到自带的mysql监控模板
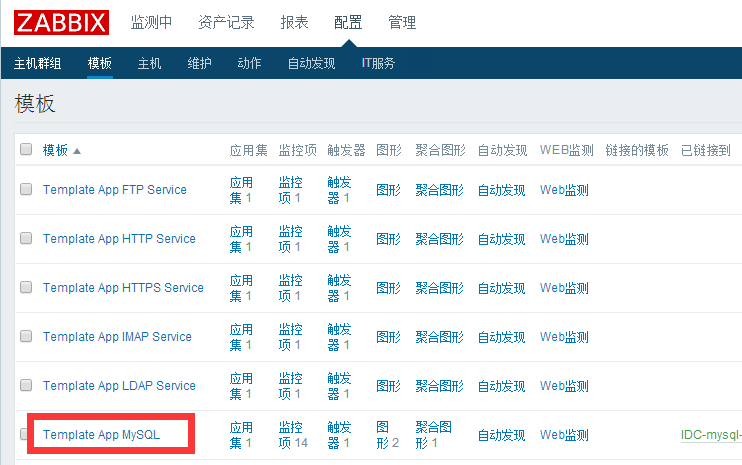
在相应主机监控配置里添加mysql的监控模版(zabbix自带的)即可。


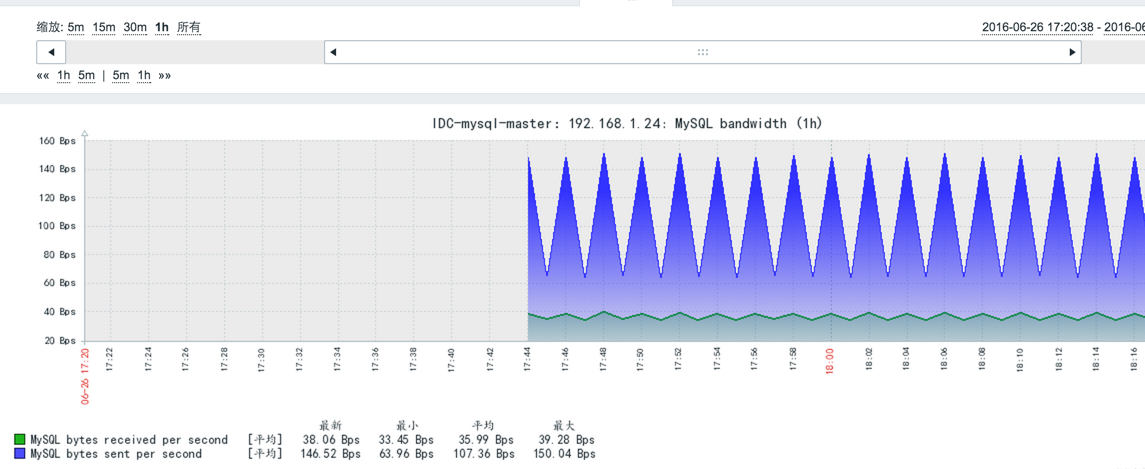
下面是mysql监控项的效果图:
【1】监控mysql的带宽:在zabbix前端可以实时查看mysql发送接收的字节数。其中bytes received表示从所有客户端接收到的字节数,bytes sent表示发送给所有客户端的字节数。
【2】监控mysql的操作状态:在zabbix前端可以实时查看各种SQL语句每秒钟的操作次数。
