参考链接https://ask.csdn.net/questions/365756
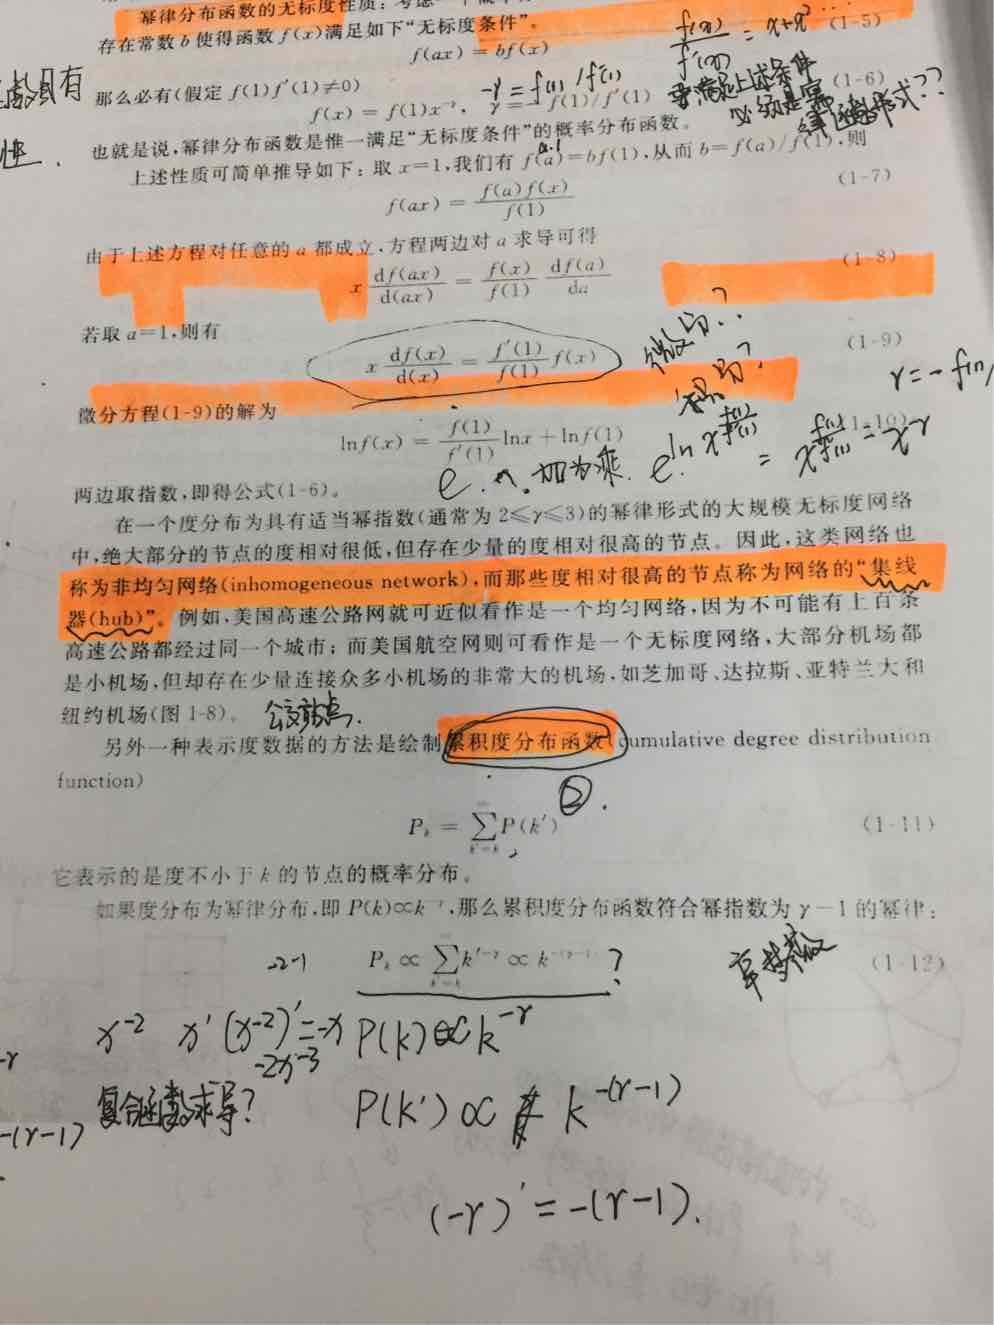
今天一直在找关于幂律分布的验证相关资料,很多都是只言片语,这个图首先解释了幂律分布的定义
2.然后,https://www.douban.com/group/topic/69712255/ 真正实践去验证的时候,先在python环境下安装powerlaw包,然后这个链接内容告诉我们具体怎么应用这个包,对每行代码的解释真心很详细!powerlaw.Fit拟合幂律分布
# -*- coding: utf-8 -*-
import numpy as np
from matplotlib.pylab import plt
import powerlaw
#打开数据包------------------------------------------------------------
data=np.loadtxt('C:/Users/peterduus/degree.txt')
#用numpy的loadtxt()方法把文本数据读入二维数组---------------------------
fit=powerlaw.Fit(data,discrete=True)
print 'xmin =',fit.xmin
print 'alpha =',fit.power_law.alpha
print 'sigma =',fit.power_law.sigma
print 'D =',fit.power_law.D
#拟合幂律,放到名为fit的对象中。网络度是离散的,所以要用discrete=True。
#是不是离散型数据,可以用fit.power_law.discrete来查看。
#计算fit的最小界值。
#计算fit的alpha值。根据所遵循公式,alpha是幂指数,即P(x)是x的-alpha次方。
也就是我们想要的参数值了,参考文献中讲到是通过最大似然估计得到的。一般幂律分布的该参数范围在2-3是很典型的值。
#sigma是alpha的标准差。
#注意看幂律区间如果占据总区间很小部分,那这种拟合是没有意义的。
R1,p1=fit.distribution_compare('power_law','exponential')
R2,p2=fit.distribution_compare('power_law','lognormal')
R3,p3=fit.distribution_compare('power_law', 'stretched_exponential')
R4,p4=fit.distribution_compare('power_law', 'truncated_power_law')
R12,p12=fit2.distribution_compare('power_law','exponential')
R22,p22=fit2.distribution_compare('power_law','lognormal')
R32,p32=fit2.distribution_compare('power_law', 'stretched_exponential')
R42,p42=fit2.distribution_compare('power_law', 'truncated_power_law')
R52,p52=fit2.distribution_compare('exponential', 'truncated_power_law')
print 'power_law vs. ','exponential ',R1,p1
print 'power_law vs. ','lognormal ',R2,p2
print 'power_law vs. ', 'stretched_exponential ',R3,p3
print 'power_law vs. ', 'truncated_power_law ',R4,p4
print '
'
print 'power_law vs. ','exponential ',R12,p12
print 'power_law vs. ', 'truncated_power_law ',R42,p42
print 'exponential vs. ', 'truncated_power_law ',R52,p52
#R是似然比,正值表示前者比后者更契合数据,
#p是两模型的差异是否具有显著性,即用R所做的比较结果是否有统计学意义
3.文章中还用到ks检验,暂时还没明白如何用代码进行检验,有待补充!