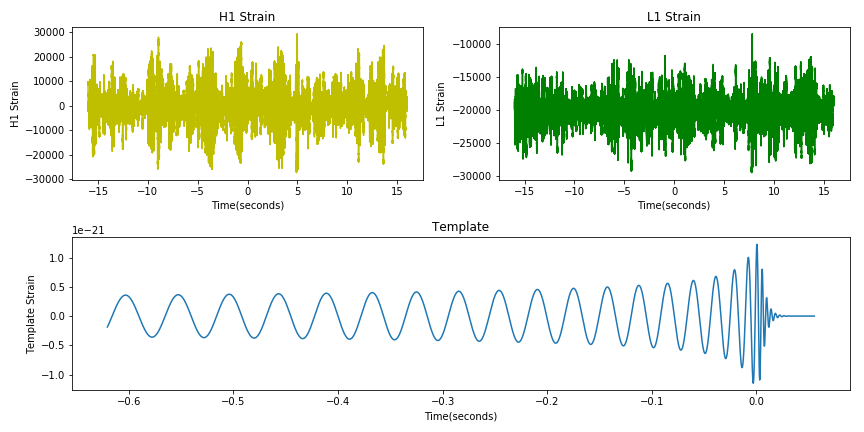
import numpy as np
import matplotlib.pyplot as plt
from scipy.io import wavfile

rate_h,hstrain = wavfile.read(r"H1_Strain.wav","rb")
rate_l,lstrain = wavfile.read(r"L1_Strain.wav","rb")
reftime, ref_H1 = np.genfromtxt(r"GW150914_4_NR_waveform_template.txt").transpose()

htime_interval = 1/rate_h
ltime_interval = 1/rate_l

htime_len = hstrain.shape[0]/rate_h
htime = np.arange(-htime_len/2,htime_len/2,htime_interval)
ltime_len = lstrain.shape[0]/rate_l
ltime = np.arange(-ltime_len/2,ltime_len/2,ltime_interval)

fig = plt.figure(figsize=(12,6))

plth = fig.add_subplot(221)
plth.plot(htime,hstrain,'y')
plth.set_xlabel('Time(seconds)')
plth.set_ylabel('H1 Strain')
plth.set_title('H1 Strain')

pltl = fig.add_subplot(222)
pltl.plot(ltime,lstrain,'g')
pltl.set_xlabel('Time(seconds)')
pltl.set_ylabel('L1 Strain')
pltl.set_title('L1 Strain')

pltref = fig.add_subplot(212)
pltref.plot(reftime,ref_H1)
pltref.set_xlabel('Time(seconds)')
pltref.set_ylabel('Template Strain')
pltref.set_title('Template')

fig.tight_layout()#自动调整图像外部边缘
plt.savefig("GWO.png")
plt.show()
plt.close(fig)