代码:
子函数ampl_res
function [Hr,w,P,L] = ampl_res(h);
%
% function [Hr,w,P,L] = Ampl_res(h)
% Computes Amplitude response Hr(w) and its polynomial P of order L,
% given a linear-phase FIR filter impulse response h.
% The type of filter is determined automatically by the suroutine.
%
% Hr = Amplitude Response
% w = Frequence between [0 pi] over which Hr is computed
% P = Polynomial coefficients
% L = Order of P
% h = Linear Phase filter impulse response
%
M = length(h);
if rem(M,2)==1
   if all(h(1:(M-1)/2)==h(M:-1:(M+3)/2)) [Hr,w,P,L] = Hr_Type1(h);
   elseif all(h(1:(M-1)/2)==-h(M:-1:(M+3)/2)) & h((M+1)/2)==0, [Hr,w,P,L] = Hr_Type3(h);
       else disp('not a linear-phase filter, check h'), return,
   end
elseif all(h(1:M/2)==h(M:-1:M/2+1)); [Hr,w,P,L] = Hr_Type2(h);
   elseif all(h(1:M/2)==-h(M:-1:M/2+1)); [Hr,w,P,L] = Hr_Type4(h);
       else disp('not a linear-phase filter, check h'), return,
   end
end
第1小题代码
%% ++++++++++++++++++++++++++++++++++++++++++++++++++++++++++++++++++++++++++++++++
%% Output Info about this m-file
fprintf('
***********************************************************
');
fprintf(' <DSP using MATLAB> Problem 7.6
');
banner();
%% ++++++++++++++++++++++++++++++++++++++++++++++++++++++++++++++++++++++++++++++++
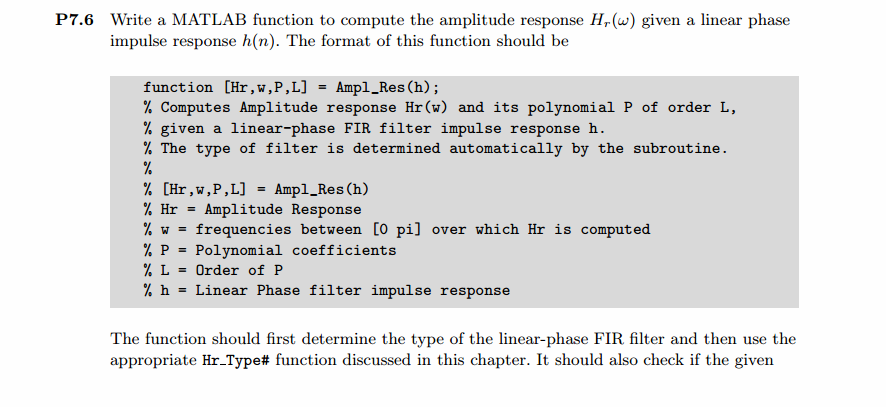
n1 = 0; n2 = 11;
n = [n1:n2];
h1n = 0.9 .^ abs(n-5) .* cos(pi*(n-5)/12) .* ( stepseq(0,n1,n2) - stepseq(11,n1,n2) );
h1n = h1n(1:11);
figure('NumberTitle', 'off', 'Name', 'Problem 7.6')
set(gcf,'Color','white');
stem([0:10], h1n); grid on;
xlabel('n'); ylabel('h1(n)'); title('Impulse Response');
[db, mag, pha, grd, w] = freqz_m(h1n, 1);
[Hr, ww, a, P] = ampl_res(h1n);
%[Hr, ww, a, P] = Hr_Type1(h1n);
% Plot
figure('NumberTitle', 'off', 'Name', 'Problem 7.6')
set(gcf,'Color','white');
subplot(2,2,1); plot(w/pi, db); grid on; axis([0 2 -100 10]);
xlabel('frequency in pi units'); ylabel('Decibels'); title('Magnitude Response in dB');
set(gca,'YTickMode','manual','YTick',[-80,-40,0]);
set(gca,'YTickLabelMode','manual','YTickLabels',['80';'40';' 0']);
subplot(2,2,3); plot(w/pi, mag); grid on; %axis([0 1 -100 10]);
xlabel('frequency in pi units'); ylabel('Absolute'); title('Magnitude Response in absolute');
subplot(2,2,2); plot(w/pi, pha); grid on; %axis([0 1 -100 10]);
xlabel('frequency in pi units'); ylabel('Rad'); title('Phase Response in Radians');
subplot(2,2,4); plot(w/pi, grd*pi/180); grid on; %axis([0 1 -100 10]);
xlabel('frequency in pi units'); ylabel('Rad'); title('Group Delay');
figure('NumberTitle', 'off', 'Name', 'Problem 7.6')
set(gcf,'Color','white');
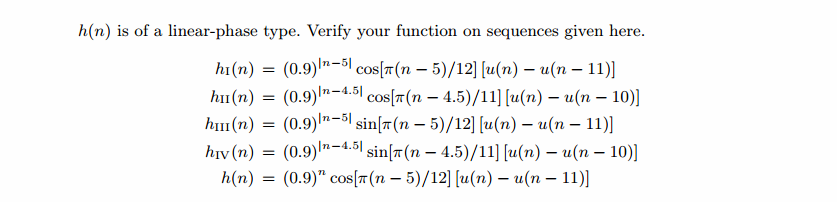
subplot(2,1,1); plot(ww/pi, Hr); grid on; axis([0, 1, 0, 8]);
xlabel('frequency in pi nuits'); ylabel('Hr'); title('Amplitude Response');
subplot(2,1,2); stem([n1:n2-1], h1n); grid on;%axis([-1, M, -1.1, 1.1]);
xlabel('n'); ylabel('h1(n)'); title('Impulse Response');
运行结果:
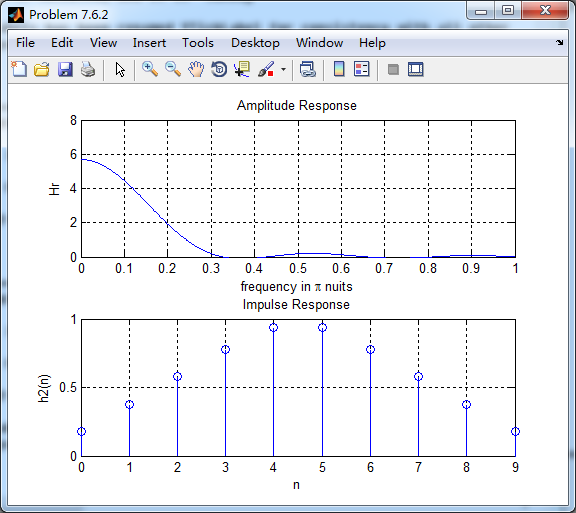
由上图看,很明显是非线性相位FIR的,但是其非零值(即前11个元素)构成线性相位FIR滤波器脉冲响应,如下

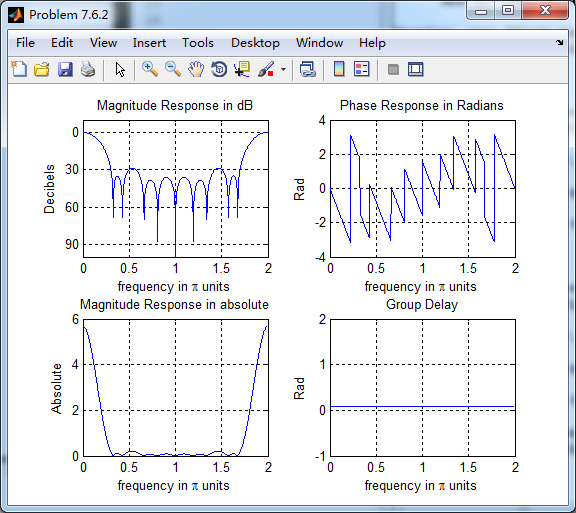
由上图可知,脉冲响应是第1类线性相位,其幅度响应(dB和绝对单位)、相位响应、群延迟响应如下:

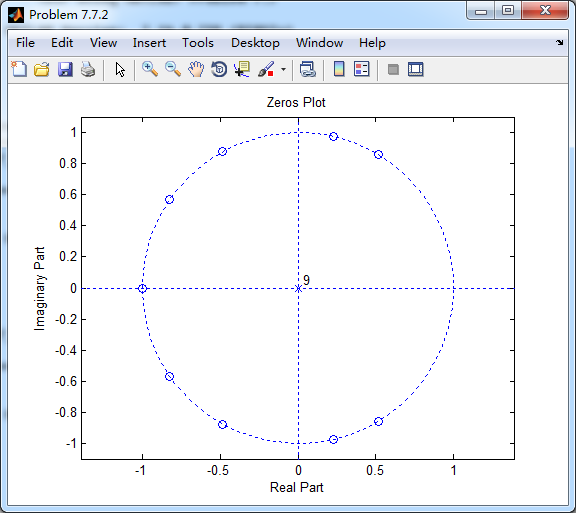
该序列的零点图如下

第2小题
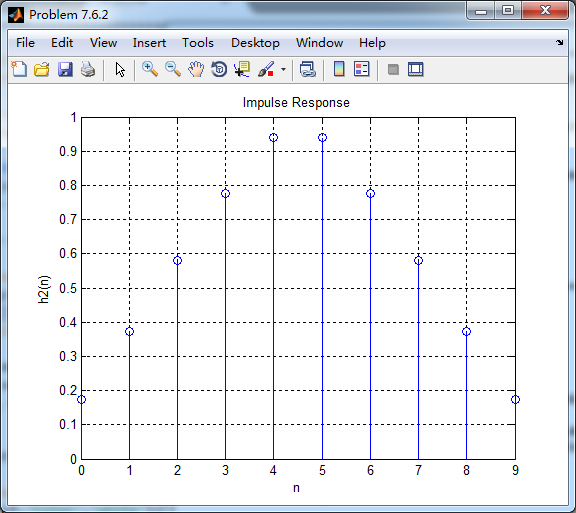
非线性相位FIR滤波器脉冲响应

取其前10个元素,构成第2类型Type-II型线性相位FIR滤波器脉冲响应
其零点图如下:
其余小题就不贴图了。