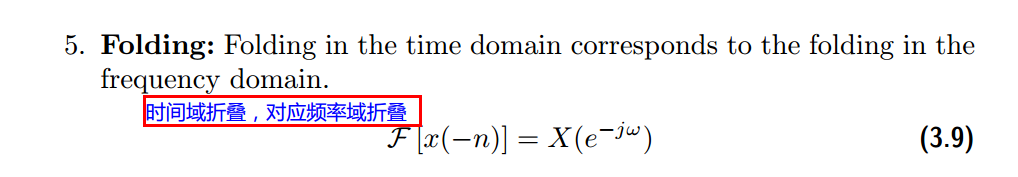
用到的性质
上代码:
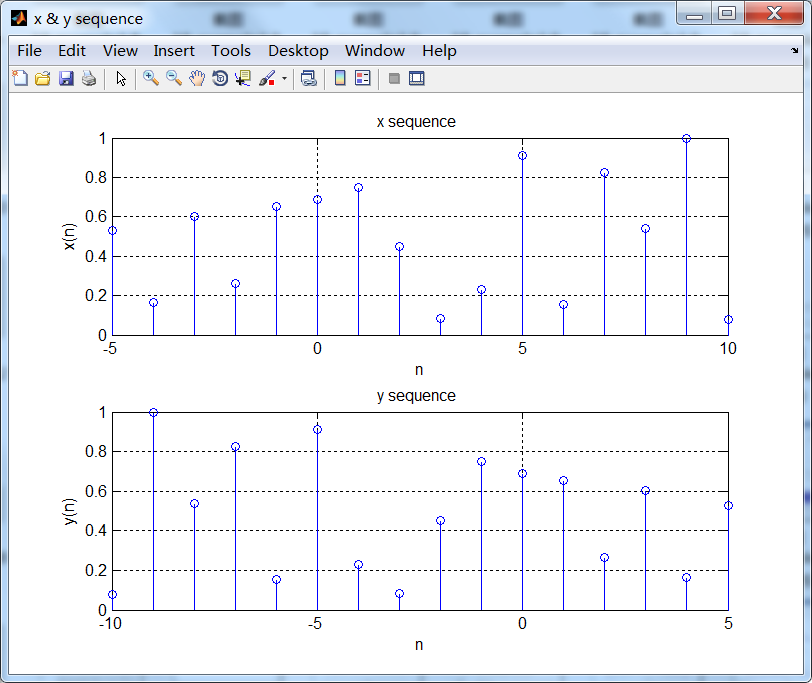
n = -5:10; x = rand(1,length(n));
k = -100:100; w = (pi/100)*k; % freqency between -pi and +pi , [0,pi] axis divided into 101 points.
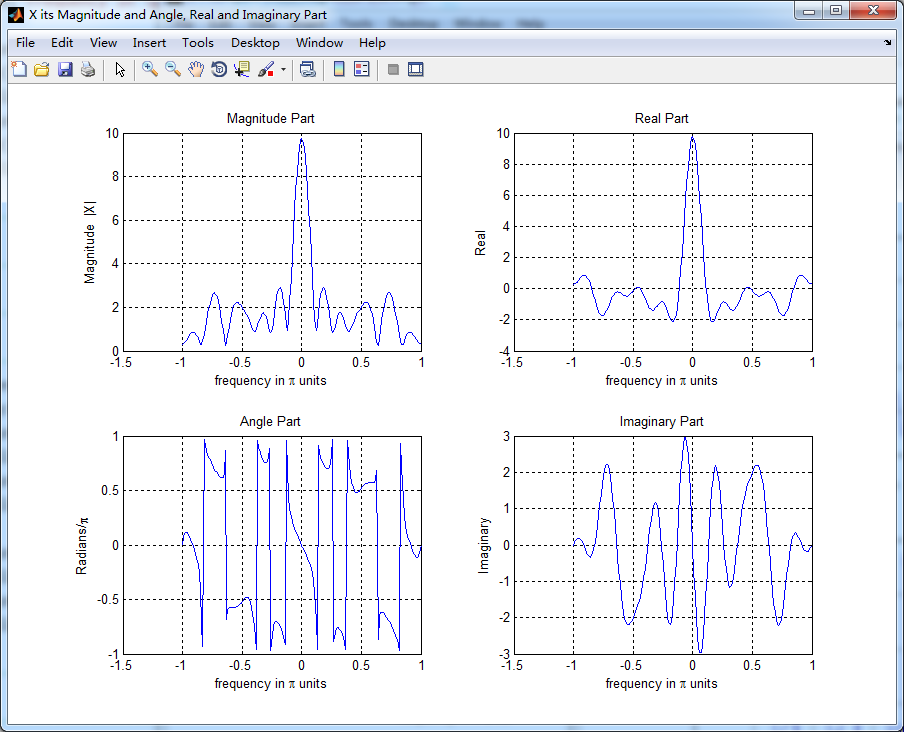
X = x * (exp(-j*pi/100)) .^ (n'*k); % DTFT of x
% folding property
y = fliplr(x); m = -fliplr(n); % signal folding
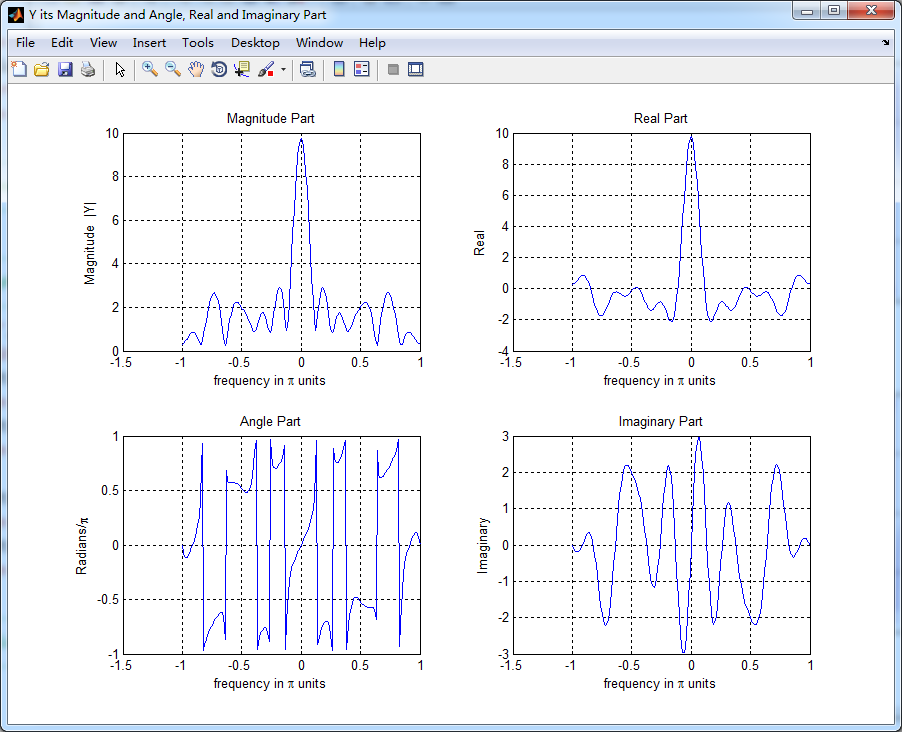
Y = y * (exp(-j*pi/100)) .^ (m'*k); % DTFT of y
magX = abs(X); angX = angle(X); realX = real(X); imagX = imag(X);
magY = abs(Y); angY = angle(Y); realY = real(Y); imagY = imag(Y);
%verification
Y_check = fliplr(X); % X(-w)
error = max(abs(Y-Y_check)); % Difference
figure('NumberTitle', 'off', 'Name', 'x & y sequence')
set(gcf,'Color','white');
subplot(2,1,1); stem(n,x); title('x sequence '); xlabel('n'); ylabel('x(n)'); grid on;
%subplot(2,2,2); stem(n,imag(x)); title('x sequence Imaginary Part'); xlabel('n'); ylabel('Imaginary x(n))'); grid on;
subplot(2,1,2); stem(m,y); title('y sequence '); xlabel('n'); ylabel('y(n)'); grid on;
%subplot(2,2,4); stem(n,imag(y)); title('y sequence Imaginary Part'); xlabel('n'); ylabel('Imaginary y(n))'); grid on;
%% --------------------------------------------------------------
%% START X's mag ang real imag
%% --------------------------------------------------------------
figure('NumberTitle', 'off', 'Name', 'X its Magnitude and Angle, Real and Imaginary Part');
set(gcf,'Color','white');
subplot(2,2,1); plot(w/pi,magX); grid on; % axis([-2,2,0,15]);
title('Magnitude Part');
xlabel('frequency in pi units'); ylabel('Magnitude |X|');
subplot(2,2,3); plot(w/pi, angX/pi); grid on; % axis([-2,2,-1,1]);
title('Angle Part');
xlabel('frequency in pi units'); ylabel('Radians/pi');
subplot('2,2,2'); plot(w/pi, realX); grid on;
title('Real Part');
xlabel('frequency in pi units'); ylabel('Real');
subplot('2,2,4'); plot(w/pi, imagX); grid on;
title('Imaginary Part');
xlabel('frequency in pi units'); ylabel('Imaginary');
%% --------------------------------------------------------------
%% END X's mag ang real imag
%% --------------------------------------------------------------
%% --------------------------------------------------------------
%% START Y's mag ang real imag
%% --------------------------------------------------------------
figure('NumberTitle', 'off', 'Name', 'Y its Magnitude and Angle, Real and Imaginary Part');
set(gcf,'Color','white');
subplot(2,2,1); plot(w/pi,magY); grid on; % axis([-2,2,0,15]);
title('Magnitude Part');
xlabel('frequency in pi units'); ylabel('Magnitude |Y|');
subplot(2,2,3); plot(w/pi, angY/pi); grid on; % axis([-2,2,-1,1]);
title('Angle Part');
xlabel('frequency in pi units'); ylabel('Radians/pi');
subplot('2,2,2'); plot(w/pi, realY); grid on;
title('Real Part');
xlabel('frequency in pi units'); ylabel('Real');
subplot('2,2,4'); plot(w/pi, imagY); grid on;
title('Imaginary Part');
xlabel('frequency in pi units'); ylabel('Imaginary');
%% --------------------------------------------------------------
%% END Y's mag ang real imag
%% --------------------------------------------------------------
%% ----------------------------------------------------------------
%% START Graphical verification
%% ----------------------------------------------------------------
figure('NumberTitle', 'off', 'Name', 'X Y compare theirs Magnitude and Angle');
set(gcf,'Color','white');
subplot(2,2,1); plot(w/pi,magX); grid on; %axis([-1,1,0,12]);
xlabel('frequency in pi units'); ylabel('|X|'); title('Magnitude of X ');
subplot(2,2,2); plot(w/pi,angX/pi); grid on; axis([-1,1,-1,1]);
xlabel('frequency in pi units'); ylabel('Radians/pi'); title('Angle of X ');
subplot(2,2,3); plot(w/pi,magY); grid on; %axis([-1,1,0,12]);
xlabel('frequency in pi units'); ylabel('|Y|'); title('Magnitude of Y ');
subplot(2,2,4); plot(w/pi,angY/pi); grid on; axis([-1,1,-1,1]);
xlabel('frequency in pi units'); ylabel('Radians/pi'); title('Angle of Y ');
%% ----------------------------------------------------------------
%% END Graphical verification
%% ----------------------------------------------------------------
运行结果: