代码:
%% ------------------------------------------------------------------------
%% Output Info about this m-file
fprintf('
***********************************************************
');
fprintf(' <DSP using MATLAB> Problem 2.9
');
banner();
%% ------------------------------------------------------------------------
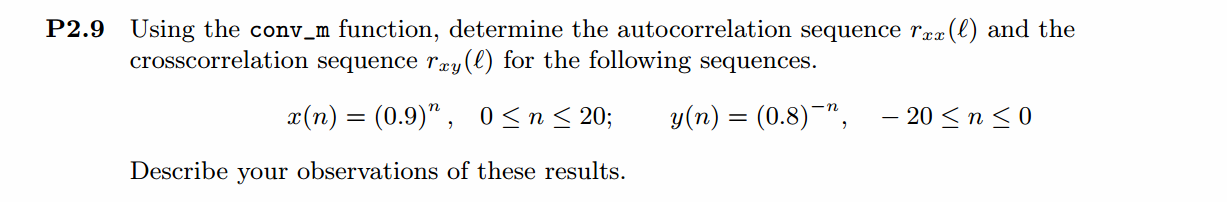
nx = [0:1:20];
x = 0.9 .^ nx;
ny = [-20:1:0];
y = 0.8 .^ (-ny);
figure('NumberTitle', 'off', 'Name', 'Problem 2.9')
set(gcf,'Color',[1,1,1]) % 改变坐标外围背景颜色
subplot(2,1,1); stem(nx, x); title('x sequence');
xlabel('n'); ylabel('x(n)') ;
grid on
subplot(2,1,2); stem(ny, y); title('y sequence');
xlabel('n'); ylabel('y(m)');
grid on;
[x1, nx1] = sigfold(x, nx); % obtain x(-n)
[y1, ny1] = sigfold(y, ny);
[Rxy, nxy] = conv_m(x1, nx1, y, ny);
[Rxx, nxx] = conv_m(x1, nx1, x, nx);
figure('NumberTitle', 'off', 'Name', 'Problem 2.9')
set(gcf,'Color',[1,1,1]) % 改变坐标外围背景颜色
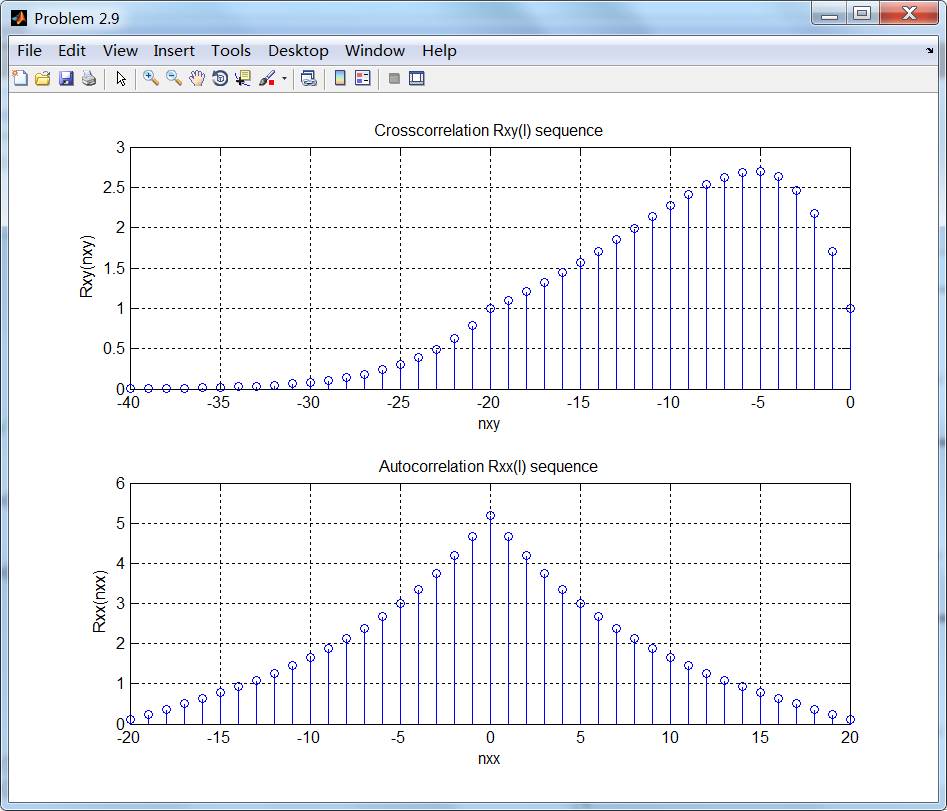
subplot(2,1,1); stem(nxy, Rxy); title('Crosscorrelation Rxy(l) sequence');
xlabel('nxy'); ylabel('Rxy(nxy)') ;
grid on
subplot(2,1,2); stem(nxx, Rxx); title('Autocorrelation Rxx(l) sequence');
xlabel('nxx'); ylabel('Rxx(nxx)');
grid on;
运行结果: