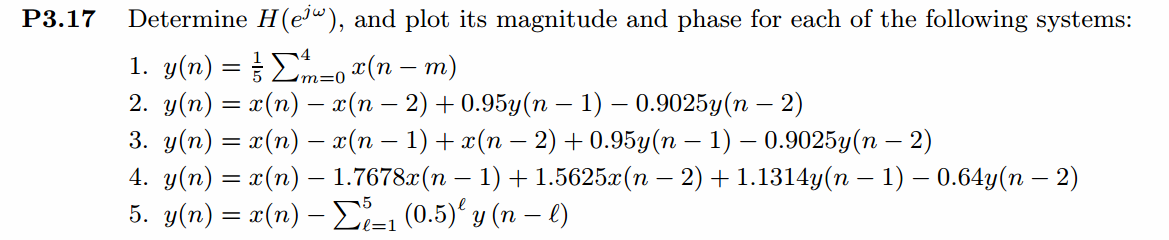
用差分方程两边进行z变换,再变量带换得到频率响应函数(或转移函数,即LTI系统脉冲响应的DTFT)。
代码:
%% ------------------------------------------------------------------------
%% Output Info about this m-file
fprintf('
***********************************************************
');
fprintf(' <DSP using MATLAB> Problem 3.17
');
banner();
%% ------------------------------------------------------------------------
%% --------------------------------------------------------------
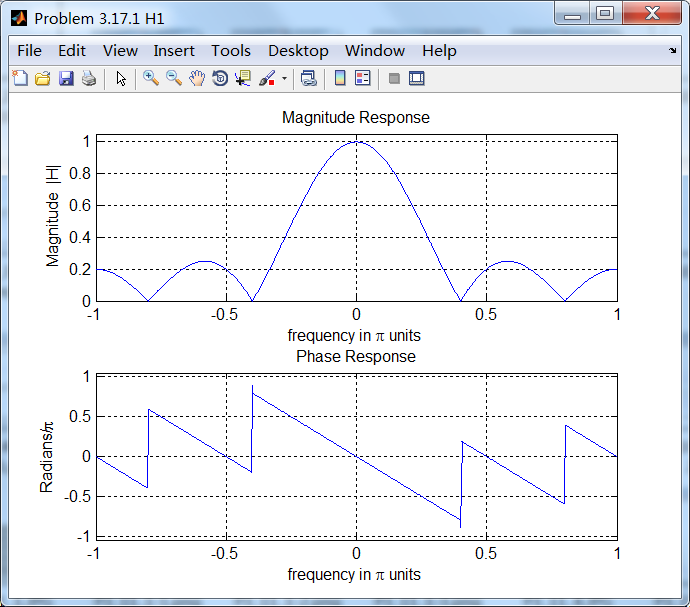
%% 1 y(n)=0.2*[x(n)+x(n-1)+x(n-2)+x(n-3)+x(n-4)]
%% --------------------------------------------------------------
a = [1]; % filter coefficient array a
b = [0.2, 0.2, 0.2, 0.2, 0.2]; % filter coefficient array b
MM = 500;
H = freqresp1(b, a, MM);
magH = abs(H); angH = angle(H); realH = real(H); imagH = imag(H);
%% --------------------------------------------------------------------
%% START H's mag ang real imag
%% --------------------------------------------------------------------
figure('NumberTitle', 'off', 'Name', 'Problem 3.17.1 H1');
set(gcf,'Color','white');
subplot(2,1,1); plot(w/pi,magH); grid on; axis([-1,1,0,1.05]);
title('Magnitude Response');
xlabel('frequency in pi units'); ylabel('Magnitude |H|');
subplot(2,1,2); plot(w/pi, angH/pi); grid on; axis([-1,1,-1.05,1.05]);
title('Phase Response');
xlabel('frequency in pi units'); ylabel('Radians/pi');
figure('NumberTitle', 'off', 'Name', 'Problem 3.17.1 H1');
set(gcf,'Color','white');
subplot(2,1,1); plot(w/pi, realH); grid on;
title('Real Part');
xlabel('frequency in pi units'); ylabel('Real');
subplot(2,1,2); plot(w/pi, imagH); grid on;
title('Imaginary Part');
xlabel('frequency in pi units'); ylabel('Imaginary');
%% -------------------------------------------------------------------
%% END X's mag ang real imag
%% -------------------------------------------------------------------
%% --------------------------------------------------------------
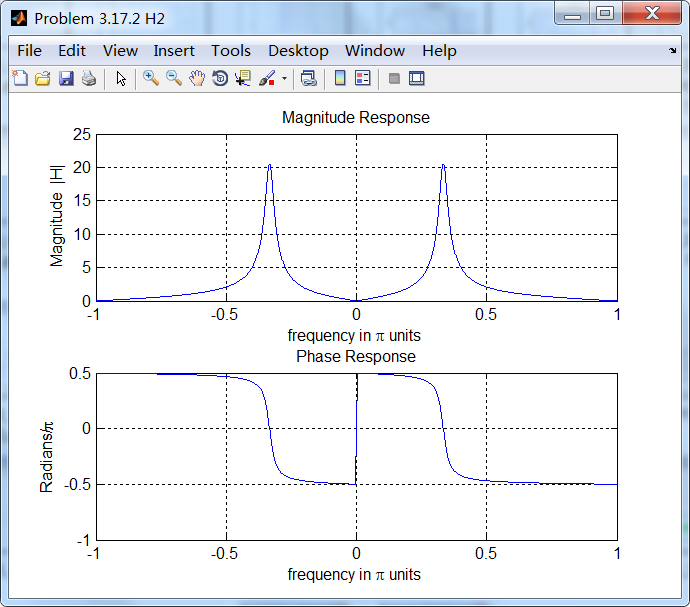
%% 2 y(n)=x(n)-x(n-2)+0.95y(n-1)-0.9025y(n-2)
%% --------------------------------------------------------------
a = [1, -0.95, 0.9025]; % filter coefficient array a
b = [1, 0, -1]; % filter coefficient array b
MM = 500;
H = freqresp1(b, a, MM);
magH = abs(H); angH = angle(H); realH = real(H); imagH = imag(H);
%% --------------------------------------------------------------------
%% START H's mag ang real imag
%% --------------------------------------------------------------------
figure('NumberTitle', 'off', 'Name', 'Problem 3.17.2 H2');
set(gcf,'Color','white');
subplot(2,1,1); plot(w/pi,magH); grid on; %axis([-1,1,0,1.05]);
title('Magnitude Response');
xlabel('frequency in pi units'); ylabel('Magnitude |H|');
subplot(2,1,2); plot(w/pi, angH/pi); grid on; %axis([-1,1,-1.05,1.05]);
title('Phase Response');
xlabel('frequency in pi units'); ylabel('Radians/pi');
figure('NumberTitle', 'off', 'Name', 'Problem 3.17.2 H2');
set(gcf,'Color','white');
subplot(2,1,1); plot(w/pi, realH); grid on;
title('Real Part');
xlabel('frequency in pi units'); ylabel('Real');
subplot(2,1,2); plot(w/pi, imagH); grid on;
title('Imaginary Part');
xlabel('frequency in pi units'); ylabel('Imaginary');
%% -------------------------------------------------------------------
%% END X's mag ang real imag
%% -------------------------------------------------------------------
%% --------------------------------------------------------------
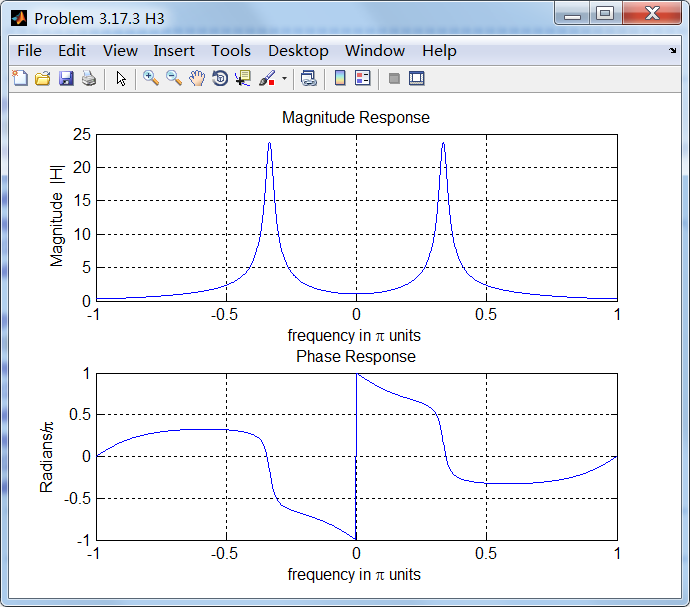
%% 3 y(n)=x(n)-x(n-1)-x(n-2)+0.95y(n-1)-0.9025y(n-2)
%% --------------------------------------------------------------
a = [1, -0.95, 0.9025]; % filter coefficient array a
b = [1, -1, -1]; % filter coefficient array b
MM = 500;
H = freqresp1(b, a, MM);
magH = abs(H); angH = angle(H); realH = real(H); imagH = imag(H);
%% --------------------------------------------------------------------
%% START H's mag ang real imag
%% --------------------------------------------------------------------
figure('NumberTitle', 'off', 'Name', 'Problem 3.17.3 H3');
set(gcf,'Color','white');
subplot(2,1,1); plot(w/pi,magH); grid on; %axis([-1,1,0,1.05]);
title('Magnitude Response');
xlabel('frequency in pi units'); ylabel('Magnitude |H|');
subplot(2,1,2); plot(w/pi, angH/pi); grid on; %axis([-1,1,-1.05,1.05]);
title('Phase Response');
xlabel('frequency in pi units'); ylabel('Radians/pi');
figure('NumberTitle', 'off', 'Name', 'Problem 3.17.3 H3');
set(gcf,'Color','white');
subplot(2,1,1); plot(w/pi, realH); grid on;
title('Real Part');
xlabel('frequency in pi units'); ylabel('Real');
subplot(2,1,2); plot(w/pi, imagH); grid on;
title('Imaginary Part');
xlabel('frequency in pi units'); ylabel('Imaginary');
%% -------------------------------------------------------------------
%% END X's mag ang real imag
%% -------------------------------------------------------------------
%% --------------------------------------------------------------
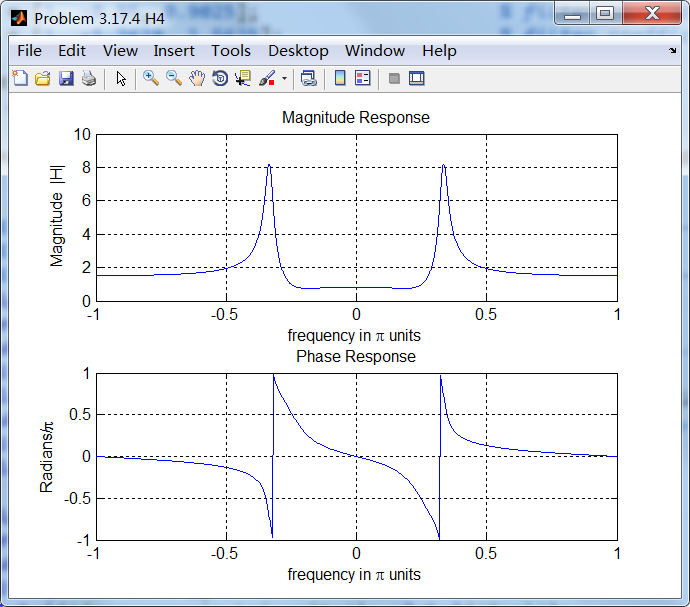
%% 4 y(n)=x(n)-1.7678x(n-1)+1.5625x(n-2)
%% +0.95y(n-1)-0.9025y(n-2)
%% --------------------------------------------------------------
a = [1, -0.95, 0.9025]; % filter coefficient array a
b = [1, -1.7678, 1.5625]; % filter coefficient array b
MM = 500;
H = freqresp1(b, a, MM);
magH = abs(H); angH = angle(H); realH = real(H); imagH = imag(H);
%% --------------------------------------------------------------------
%% START H's mag ang real imag
%% --------------------------------------------------------------------
figure('NumberTitle', 'off', 'Name', 'Problem 3.17.4 H4');
set(gcf,'Color','white');
subplot(2,1,1); plot(w/pi,magH); grid on; %axis([-1,1,0,1.05]);
title('Magnitude Response');
xlabel('frequency in pi units'); ylabel('Magnitude |H|');
subplot(2,1,2); plot(w/pi, angH/pi); grid on; %axis([-1,1,-1.05,1.05]);
title('Phase Response');
xlabel('frequency in pi units'); ylabel('Radians/pi');
figure('NumberTitle', 'off', 'Name', 'Problem 3.17.4 H4');
set(gcf,'Color','white');
subplot(2,1,1); plot(w/pi, realH); grid on;
title('Real Part');
xlabel('frequency in pi units'); ylabel('Real');
subplot(2,1,2); plot(w/pi, imagH); grid on;
title('Imaginary Part');
xlabel('frequency in pi units'); ylabel('Imaginary');
%% -------------------------------------------------------------------
%% END X's mag ang real imag
%% -------------------------------------------------------------------
%% ------------------------------------------------------------------------------
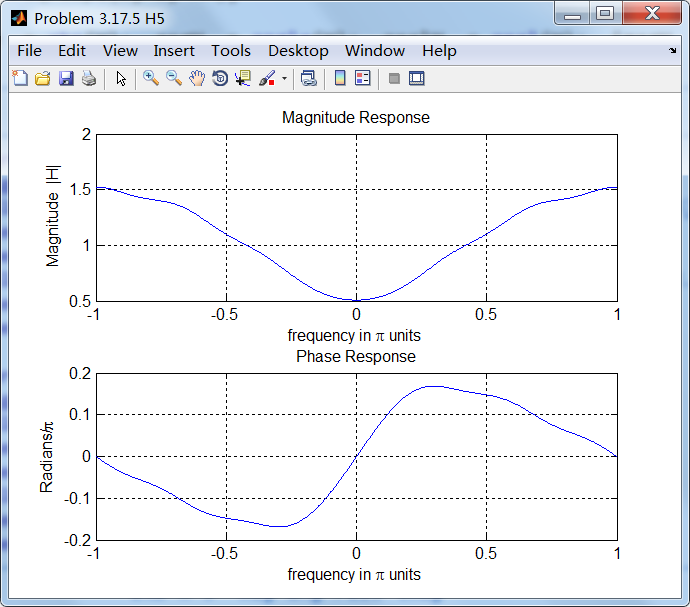
%% 5 y(n)=x(n)-0.5y(n-1)-0.25y(n-2)-0.125y(n-3)-0.0625y(n-4)-0.03125y(n-5)
%%
%% ------------------------------------------------------------------------------
a = [1, 0.5, 0.25, 0.125, 0.0625, 0.03125]; % filter coefficient array a
b = [1]; % filter coefficient array b
MM = 500;
H = freqresp1(b, a, MM);
magH = abs(H); angH = angle(H); realH = real(H); imagH = imag(H);
%% --------------------------------------------------------------------
%% START H's mag ang real imag
%% --------------------------------------------------------------------
figure('NumberTitle', 'off', 'Name', 'Problem 3.17.5 H5');
set(gcf,'Color','white');
subplot(2,1,1); plot(w/pi,magH); grid on; %axis([-1,1,0,1.05]);
title('Magnitude Response');
xlabel('frequency in pi units'); ylabel('Magnitude |H|');
subplot(2,1,2); plot(w/pi, angH/pi); grid on; %axis([-1,1,-1.05,1.05]);
title('Phase Response');
xlabel('frequency in pi units'); ylabel('Radians/pi');
figure('NumberTitle', 'off', 'Name', 'Problem 3.17.5 H5');
set(gcf,'Color','white');
subplot(2,1,1); plot(w/pi, realH); grid on;
title('Real Part');
xlabel('frequency in pi units'); ylabel('Real');
subplot(2,1,2); plot(w/pi, imagH); grid on;
title('Imaginary Part');
xlabel('frequency in pi units'); ylabel('Imaginary');
%% -------------------------------------------------------------------
%% END X's mag ang real imag
%% -------------------------------------------------------------------
运行结果: