

第1小题
代码:
%% ++++++++++++++++++++++++++++++++++++++++++++++++++++++++++++++++++++++++++++++++++++++++
%% Output Info about this m-file
fprintf('
***********************************************************
');
fprintf(' <DSP using MATLAB> Problem 5.34
');
banner();
%% ++++++++++++++++++++++++++++++++++++++++++++++++++++++++++++++++++++++++++++++++++++++++
% -------------------------------------------------------------------------------------
% X(k) is DFTs of real-valued sequence x(n)
% x(n)=A*cos(2*pi*l*n/N) n=[0:N-1]
%
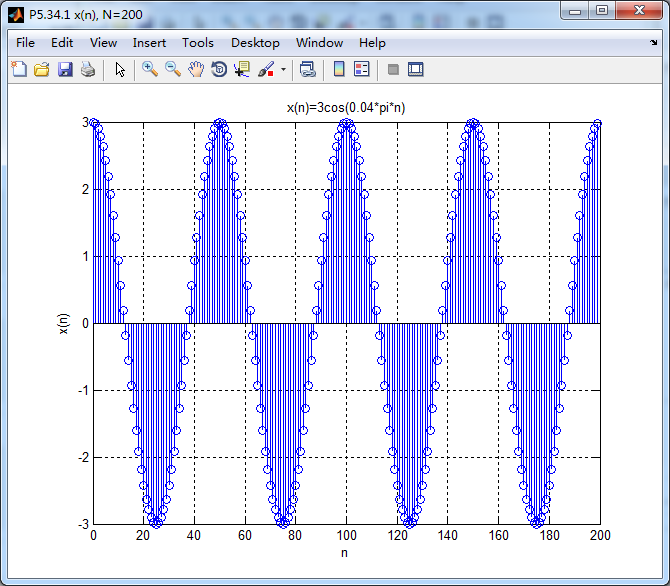
% 1 x1(n) = 3cos(0.04*pi*n) n=[0:200-1]
% -------------------------------------------------------------------------------------
N = 200; l = 2;
n1 = [0:N-1];
x1 = 3*cos(2*pi*l*n1/100);
figure('NumberTitle', 'off', 'Name', 'P5.34.1 x(n), N=200')
set(gcf,'Color','white');
stem(n1, x1);
xlabel('n'); ylabel('x(n)');
title('x(n)=3cos(0.04*pi*n)'); grid on;
k1 = [0:N-1];
Xk_DFT = fft(x1, N);
N1 = length(Xk_DFT); % length
magXk_DFT = abs( [ Xk_DFT ] ); % DFT magnitude
angXk_DFT = angle( [Xk_DFT] )/pi; % DFT angle
realXk_DFT = real(Xk_DFT); imagXk_DFT = imag(Xk_DFT);
figure('NumberTitle', 'off', 'Name', 'P5.34.1 X(k), DFT of x(n) N=200')
set(gcf,'Color','white');
subplot(2,2,1); stem(k1, magXk_DFT);
xlabel('k'); ylabel('magnitude(k)');
title('magnitude DFT of x(n)'); grid on;
subplot(2,2,3); stem(k1, angXk_DFT);
%axis([-N/2, N/2, -0.5, 50.5]);
xlabel('k'); ylabel('angle(k)');
title('angle DFT of x(n)'); grid on;
subplot(2,2,2); stem(k1, realXk_DFT);
xlabel('k'); ylabel('real (k)');
title('real DFT of x(n)'); grid on;
subplot(2,2,4); stem(k1, imagXk_DFT);
%axis([-N/2, N/2, -0.5, 50.5]);
xlabel('k'); ylabel('imag (k)');
title('imag DFT of x(n)'); grid on;
figure('NumberTitle', 'off', 'Name', 'P5.34.1 real X(k), N=200')
set(gcf,'Color','white');
stem(k1, realXk_DFT);
xlabel('k'); ylabel('real (k)');
title('real DFT of x(n)'); grid on;
运行结果:
N=200个样点共包含4个周期:
序列的DFT

DFT的实部序列

由上图可知,有两条孤立谱线,位于k=L=4和k=N-L=200-4=196处,幅度值AN/2=3×200/2=300。