GoJS示例


<!DOCTYPE html>
<html lang="en">
<head>
    <meta charset="UTF-8">
    <title>Title</title>
</head>
<body>
<div id="myDiagramDiv" style="500px; height:350px; background-color: #DAE4E4;"></div>


<script src="gojs/go.js"></script>

<script>
    var $ = go.GraphObject.make;
    // 第一步:创建图表
    var myDiagram = $(go.Diagram, "myDiagramDiv"); // 创建图表,用于在页面上画图

    // 第二步:创建一个节点,内容为武沛齐
    var node = $(go.Node, $(go.TextBlock, {text: "武沛齐"}));

    // 第三步:将节点添加到图表中
    myDiagram.add(node)
</script>
</body>
</html>

示例1
<!DOCTYPE html>
<html lang="en">
<head>
    <meta charset="UTF-8">
    <title>Title</title>
</head>
<body>
<div id="myDiagramDiv" style="500px; height:350px; background-color: #DAE4E4;"></div>


<script src="gojs/go.js"></script>

<script>
    var $ = go.GraphObject.make;
    // 第一步:创建图表
    var myDiagram = $(go.Diagram, "myDiagramDiv"); // 创建图表,用于在页面上画图


    var node1 = $(go.Node, $(go.TextBlock, {text: "武沛齐"}));
    myDiagram.add(node1);

    var node2 = $(go.Node, $(go.TextBlock, {text: "武沛齐", stroke: 'red'}));
    myDiagram.add(node2);

    var node3 = $(go.Node, $(go.TextBlock, {text: "武沛齐", background: 'lightblue'}));
    myDiagram.add(node3);


</script>
</body>
</html>

TextBlock
<!DOCTYPE html>
<html lang="en">
<head>
    <meta charset="UTF-8">
    <title>Title</title>
</head>
<body>
<div id="myDiagramDiv" style="500px; height:350px; background-color: #DAE4E4;"></div>


<script src="gojs/go.js"></script>
<script src="gojs/Figures.js"></script>

<script>
    var $ = go.GraphObject.make;

    var myDiagram = $(go.Diagram, "myDiagramDiv"); // 创建图表,用于在页面上画图

    var node1 = $(go.Node,
        $(go.Shape, {figure: "Ellipse",  40, height: 40})
    );
    myDiagram.add(node1);

    var node2 = $(go.Node,
        $(go.Shape, {figure: "RoundedRectangle",  40, height: 40, fill: 'green',stroke:'red'})
    );
    myDiagram.add(node2);

    var node3 = $(go.Node,
        $(go.Shape, {figure: "Rectangle",  40, height: 40, fill: null})
    );
    myDiagram.add(node3);


    var node4 = $(go.Node,
        $(go.Shape, {figure: "Diamond",  40, height: 40, fill: '#ddd'})
    );
    myDiagram.add(node4);

    // 需要引入Figures.js
    var node5 = $(go.Node,
        $(go.Shape, {figure: "Club",  40, height: 40, fill: 'red'})
    );
    myDiagram.add(node5);

</script>
</body>
</html>

Shape
<!DOCTYPE html>
<html lang="en">
<head>
    <meta charset="UTF-8">
    <title>Title</title>
</head>
<body>
<div id="myDiagramDiv" style="500px; height:350px; background-color: #DAE4E4;"></div>


<script src="gojs/go.js"></script>
<script src="gojs/Figures.js"></script>

<script>
    var $ = go.GraphObject.make;

    var myDiagram = $(go.Diagram, "myDiagramDiv"); // 创建图表,用于在页面上画图


    var node1 = $(go.Node,
        "Vertical",
        {
            background: 'yellow',
            padding: 8
        },
        $(go.Shape, {figure: "Ellipse",  40, height: 40}),
        $(go.TextBlock, {text: "武沛齐"})
    );
    myDiagram.add(node1);

    var node2 = $(go.Node,
        "Horizontal",
        {
            background: 'white',
            padding: 5
        },
        $(go.Shape, {figure: "RoundedRectangle",  40, height: 40}),
        $(go.TextBlock, {text: "武沛齐"})
    );
    myDiagram.add(node2);

    var node3 = $(go.Node,
        "Auto",
        $(go.Shape, {figure: "Ellipse",  80, height: 80, background: 'green', fill: 'red'}),
        $(go.TextBlock, {text: "武沛齐"})
    );
    myDiagram.add(node3);


</script>
</body>
</html>

Node
<!DOCTYPE html>
<html lang="en">
<head>
    <meta charset="UTF-8">
    <title>Title</title>
</head>
<body>
<div id="myDiagramDiv" style="500px; min-height:450px; background-color: #DAE4E4;"></div>


<script src="gojs/go-debug.js"></script>

<script>
    var $ = go.GraphObject.make;

    var myDiagram = $(go.Diagram, "myDiagramDiv",
        {layout: $(go.TreeLayout, {angle: 0})}
    ); // 创建图表,用于在页面上画图

    var startNode = $(go.Node, "Auto",
        $(go.Shape, {figure: "Ellipse",  40, height: 40, fill: '#79C900', stroke: '#79C900'}),
        $(go.TextBlock, {text: '开始', stroke: 'white'})
    );
    myDiagram.add(startNode);


    var downloadNode = $(go.Node, "Auto",
        $(go.Shape, {figure: "RoundedRectangle", height: 40, fill: '#79C900', stroke: '#79C900'}),
        $(go.TextBlock, {text: '下载代码', stroke: 'white'})
    );
    myDiagram.add(downloadNode);

    var startToDownloadLink = $(go.Link,
        {fromNode: startNode, toNode: downloadNode},
        $(go.Shape, {strokeWidth: 1}),
        $(go.Shape, {toArrow: "OpenTriangle", fill: null, strokeWidth: 1})
    );
    myDiagram.add(startToDownloadLink);


    var zipNode = $(go.Node, "Auto",
        $(go.Shape, {figure: "RoundedRectangle", height: 40, fill: '#79C900', stroke: '#79C900'}),
        $(go.TextBlock, {text: '本地打包', stroke: 'white'})
    );
    myDiagram.add(zipNode);

    var downloadToZipLink = $(go.Link,
        {fromNode: downloadNode, toNode: zipNode},
        $(go.Shape, {strokeWidth: 1}),
        $(go.Shape, {toArrow: "OpenTriangle", fill: null, strokeWidth: 1})
    );
    myDiagram.add(downloadToZipLink);


    for (var i = 1; i < 6; i++) {
        var node = $(go.Node, "Auto",
            $(go.Shape, {figure: "RoundedRectangle", height: 40, fill: 'lightgray', stroke: 'lightgray'}),
            $(go.TextBlock, {text: '服务器' + i, stroke: 'white', margin: 5})
        );
        myDiagram.add(node);

        var nodeToZipLink = $(go.Link,
            {fromNode: zipNode, toNode: node, routing: go.Link.Orthogonal},
            $(go.Shape, {strokeWidth: 1, stroke: 'lightgray'}),
            $(go.Shape, {toArrow: "OpenTriangle", fill: null, strokeWidth: 1, stroke: 'lightgray'})
        );
        myDiagram.add(nodeToZipLink);
    }

</script>
</body>
</html>

Link
<!DOCTYPE html>
<html lang="en">
<head>
    <meta charset="UTF-8">
    <title>Title</title>

</head>
<body>
<div id="diagramDiv" style="100%; min-height:450px; background-color: #DAE4E4;"></div>


<script src="gojs/go-no-logo.js"></script>
<script>
    var $ = go.GraphObject.make;
    var diagram = $(go.Diagram, "diagramDiv", {
        layout: $(go.TreeLayout, {
            angle: 0,
            nodeSpacing: 20,
            layerSpacing: 70
        })
    });

    diagram.nodeTemplate = $(go.Node, "Auto",
        $(go.Shape, {
            figure: "RoundedRectangle",
            fill: 'lightgray',
            stroke: 'lightgray'
        }, new go.Binding("figure", "figure"), new go.Binding("fill", "color"), new go.Binding("stroke", "color")),
        $(go.TextBlock, {margin: 8}, new go.Binding("text", "text"))
    );

    diagram.linkTemplate = $(go.Link,
        {routing: go.Link.Orthogonal},
        $(go.Shape, {stroke: 'lightgray'}, new go.Binding('stroke', 'link_color')),
        $(go.Shape, {toArrow: "OpenTriangle", stroke: 'lightgray'}, new go.Binding('stroke', 'link_color')),
        $(go.TextBlock, {font: '8pt serif', segmentOffset: new go.Point(0, -10)}, new go.Binding("text", "link_text"))
    );

    var nodeDataArray = [
        {key: "start", text: '开始', figure: 'Ellipse', color: "lightgreen"},
        {key: "download", parent: 'start', text: '下载代码', color: "lightgreen", link_text: '执行中...'},
        {key: "compile", parent: 'download', text: '本地编译', color: "lightgreen"},
        {key: "zip", parent: 'compile', text: '打包', color: "red", link_color: 'red'},
        {key: "c1", text: '服务器1', parent: "zip"},
        {key: "c11", text: '服务重启', parent: "c1"},
        {key: "c2", text: '服务器2', parent: "zip"},
        {key: "c21", text: '服务重启', parent: "c2"},
        {key: "c3", text: '服务器3', parent: "zip"},
        {key: "c31", text: '服务重启', parent: "c3"}
    ];
    diagram.model = new go.TreeModel(nodeDataArray);

    /*
    diagram.model.addNodeData({key: "c4", text: '服务器3', parent: "c3", color: "lightgreen"})
    var c1 = diagram.model.findNodeDataForKey("c1");
    diagram.model.setDataProperty(c1, "color", "red");
    */

</script>
</body>
</html>

数据绑定
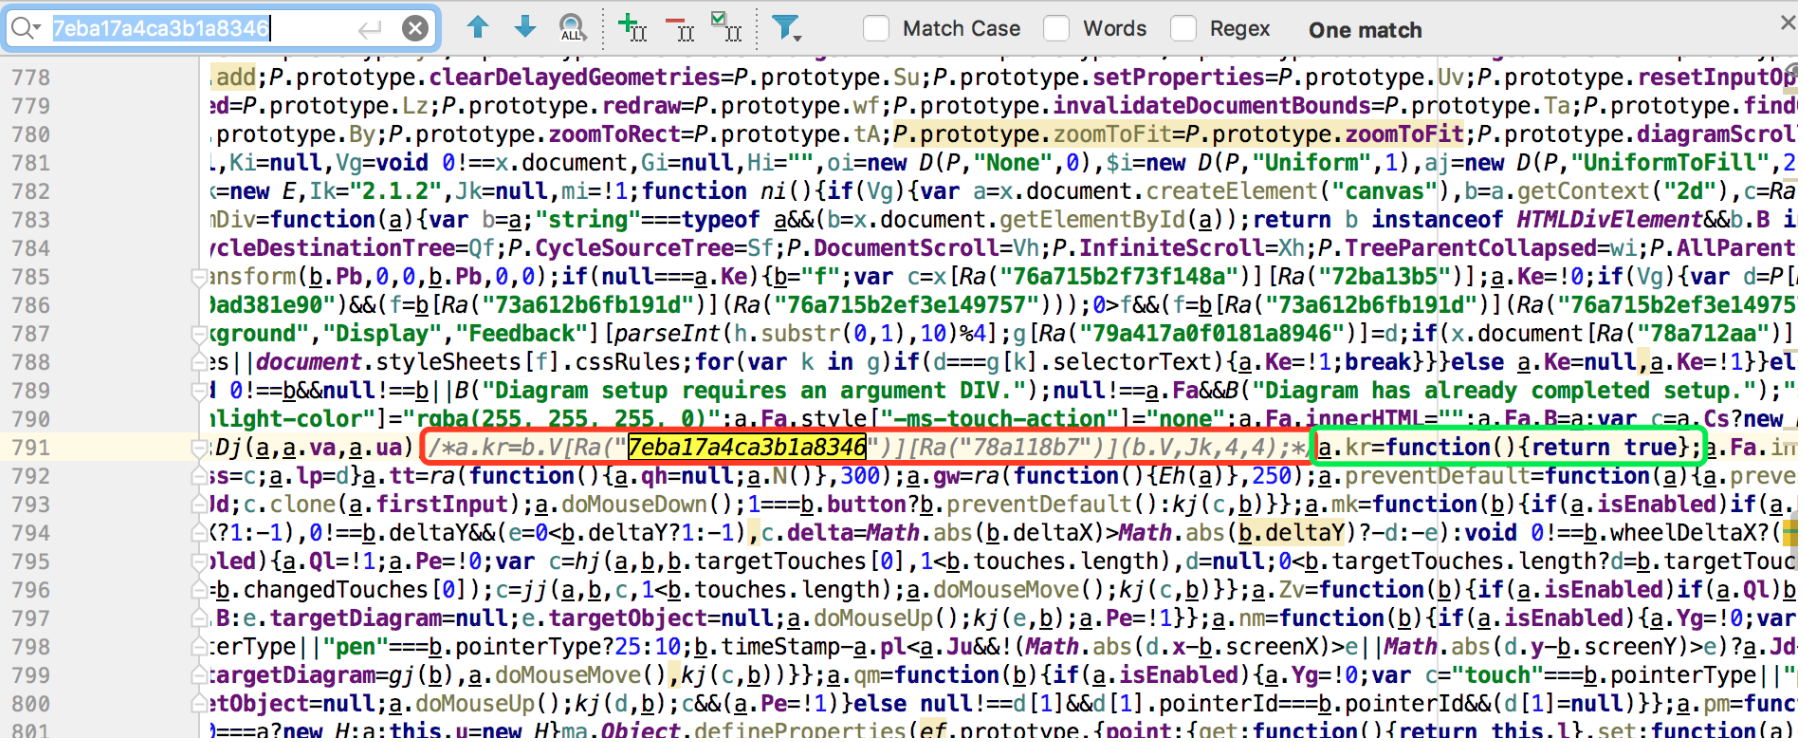
去除Logo
找到 go.js 文件,查找字符串 7eba17a4ca3b1a8346 ,然后替换指定内容。
下载GoJS插件:猛击这里 或 https://gojs.net/