学习链接:https://www.cnblogs.com/sun0618-/p/10742303.html
别人做的笔记实在是太好了,所以就参考别人的东西做学习笔记了
“做好笔记”———这是自己有待学习的地方。
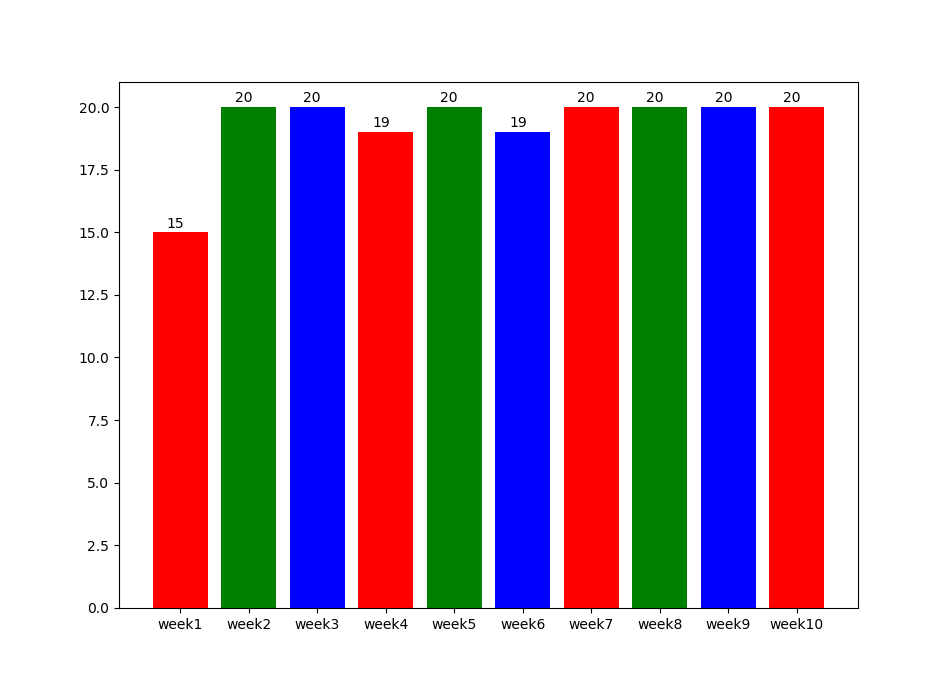
import matplotlib.pyplot as plt
def autolabel(rects):
    for rect in rects:
        height = rect.get_height()
        plt.text(rect.get_x()+rect.get_width()/2.- 0.2, 1.01*height, '%s' % int(height))


name_list = ['week1', 'week2', 'week3', 'week4', 'week5',
             'week6', 'week7', 'week8','week9','week10']
num_list = [15,20,20,19,20,19,20,20,20,20]
autolabel(plt.bar(range(len(num_list)), num_list, color='rgb', tick_label=name_list))
plt.show()
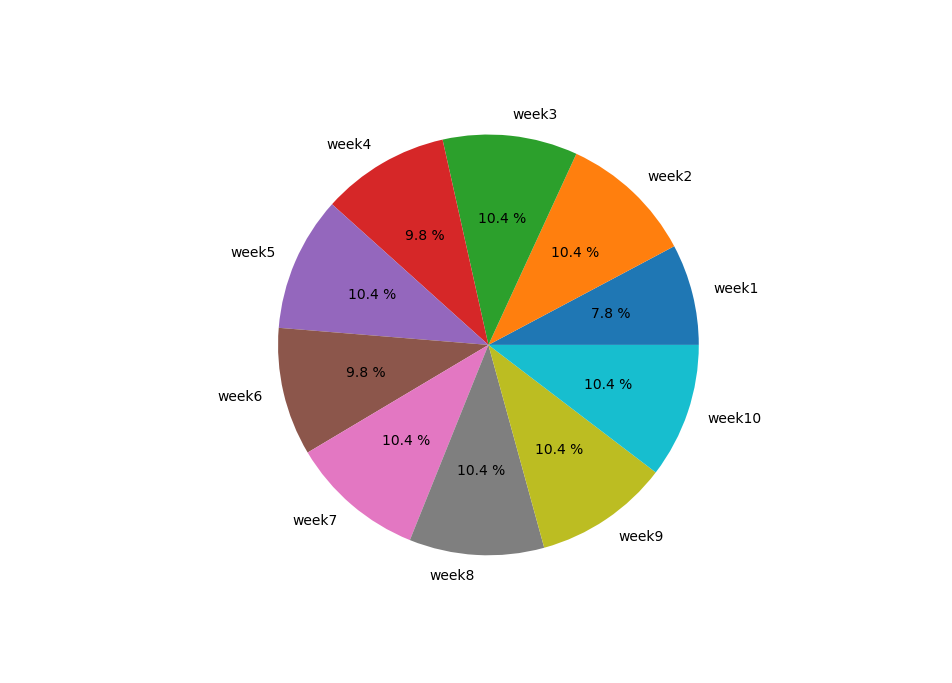
import matplotlib.pyplot as plt
name_list = ['week1', 'week2', 'week3', 'week4', 'week5',
'week6', 'week7', 'week8','week9','week10']
num_list = [15,20,20,19,20,19,20,20,20,20]
# 保证圆形
plt.axes(aspect=1)
plt.pie(x=num_list, labels=name_list, autopct='%3.1f %%')
plt.show()
import numpy as np
import matplotlib.pyplot as plt
import matplotlib
matplotlib.rcParams['font.family'] = 'SimHei'
matplotlib.rcParams['font.sans-serif'] = ['SimHei']
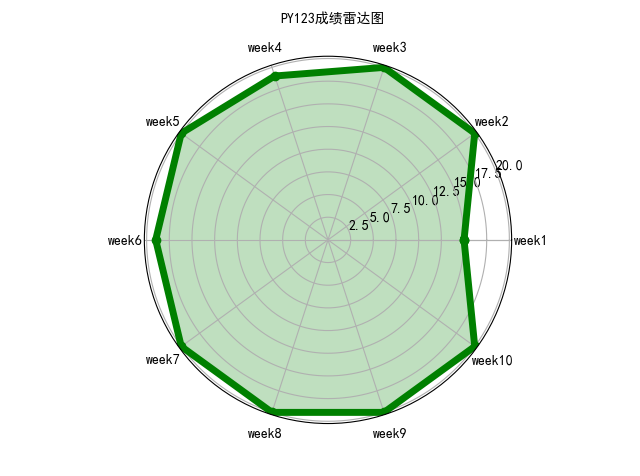
lables = np.array(['week1', 'week2', 'week3', 'week4', 'week5',
'week6', 'week7', 'week8','week9','week10'])
nAttr = 10
date = np.array([15,20,20,19,20,19,20,20,20,20])
angles = np.linspace(0, 2*np.pi, nAttr, endpoint=False)
date = np.concatenate((date, [date[0]]))
angles = np.concatenate((angles, [angles[0]]))
fig = plt.figure(facecolor="white")
plt.subplot(111, polar=True)
plt.plot(angles, date, 'bo-', color = 'g', linewidth = 5)
plt.fill(angles, date, facecolor = 'g', alpha = 0.25)
plt.thetagrids(angles*180/np.pi, lables)
plt.figtext(0.52, 0.95, 'PY123成绩雷达图', ha='center') #2019310143132
plt.grid(True)
plt.savefig('dota_radar.JPG')
plt.show()
这几张图也是借鉴别人的方法,至于链接我实在是忘了在哪里来的就不给出了。
以下为心得体会:
1.当你不知道要怎么做表以及做好看的表时,最好参考一下大神们对于参数的设置以及代码的结构。
2.如果不懂什么参数是什么意思的时候,最好每个都改一下试一下,这样子比较图与图之间的差距是最容易得到结论的。
另外不得不提一句:数学建模真的太痛苦了,建模完后整个人都变痴呆了。