代码有注释,在通用性方面进行了处理
可以指定极值,可以自定义分段,对样本数据分段比较灵活,
不填临界值时平均分段,不指定极值时样本数据中的最大值为极大值。极小值默认为0,但可以设置。
    /// <summary>
    /// 提供获取统计图的相关方法
    /// 适合有极值和无极值,无极值时采用样本内的极值
    /// 除极小值包含在近右片外,其他临界值包含在近左片
    /// </summary>
    public class StatisticsGraph
    {
        /// <summary>
        /// 样本数据
        /// </summary>
        private List<float> Samples = null;

        private int NumberOfSegments = 10;//段数 即得到的图线有10个柱

        private double MaxSample = 0;//最大样本数据

        private double MinSample = 0;//最小样本数据

        private int MaxExtremum = 100;//样本极值 ,如统计学生成绩时 极值一般为100,即卷满分


        private float[] Demarcation = new float[] { 10, 20, 30, 40, 50, 60, 70, 80, 90 };//限有极值时设置

        /// <summary>
        /// 根据样本数据初始化
        /// </summary>
        /// <param name="samples"></param>
        public StatisticsGraph(List<float> samples)
        {
            this.Init(samples);
        }

        /// <summary>
        /// 通过指定分片段数和样本数据进行初始化
        /// </summary>
        /// <param name="samples"></param>
        /// <param name="numberOfSegments"></param>
        public StatisticsGraph(List<float> samples, int numberOfSegments)
        {
            this.HasSpecifiedExtremum = false;
            this.Init(samples);
            this.NumberOfSegments = numberOfSegments;

            this.Demarcation = GetDemarcation();
        }

        /// <summary>
        /// 通过指定分片段数、极大值和样本数据进行初始化
        /// </summary>
        /// <param name="samples"></param>
        /// <param name="numberOfSegments"></param>
        /// <param name="maxExtremum"></param>
        public StatisticsGraph(List<float> samples, int numberOfSegments, int maxExtremum)
        {
            this.HasSpecifiedExtremum = true;
            this.MaxExtremum = maxExtremum;

            this.Init(samples);

            this.NumberOfSegments = numberOfSegments;

            this.Demarcation = GetDemarcation();

        }

        /// <summary>
        /// 通过指定极大值、样本数据和自定义分段临界值进行初始化
        /// </summary>
        /// <param name="samples"></param>
        /// <param name="demarcation"></param>
        /// <param name="maxExtremum"></param>
        public StatisticsGraph(List<float> samples, float[] demarcation, int maxExtremum)
        {
            this.HasSpecifiedExtremum = true;
            this.Init(samples);
            this.MaxExtremum = maxExtremum;
            this.Demarcation = demarcation;
            this.NumberOfSegments = demarcation.Count();
        }

        public int MinExtremum = 0;//最小极值默认为0

        private void Init(List<float> samples)
        {
            this.Samples = samples;

            this.MaxSample = Samples.Max();

            this.MinSample = Samples.Min();
        }

        /// <summary>
        /// 是否指定了极大值
        /// </summary>
        private bool _hasSpecifiedExtremum = true;

        /// <summary>
        /// 是否已经指定了极大值
        /// </summary>
        public bool HasSpecifiedExtremum { get { return _hasSpecifiedExtremum; } private set { _hasSpecifiedExtremum = value; } }

        /// <summary>
        /// 获取每个分片的临界点
        /// </summary>
        /// <returns></returns>
        private float[] GetDemarcation()
        {
            if (NumberOfSegments <= 1)
            {
                return null;
            }

            float[] result = new float[NumberOfSegments - 1];

            if (HasSpecifiedExtremum == false)//未指定极大值时 样本中最大值为统计范围内极大值
            {
                MaxExtremum = Convert.ToInt32(Math.Floor(MaxSample)) + 1;

                MinExtremum = Convert.ToInt32(Math.Floor(MinSample)) - 1;
            }

            int span = MaxExtremum - MinExtremum;//极值跨度

            float segSpan = span * 1f / NumberOfSegments;//每个片段的跨度

            for (int i = 0; i < NumberOfSegments - 1; i++)
            {
                result[i] = MinExtremum + segSpan * (i + 1);
            }

            return result;
        }

        /// <summary>
        /// 获取各个分片的样本数量
        /// 结果《分片的极右值,该片的样本数》
        /// 分片总数为临界点数+1个
        /// </summary>
        /// <returns></returns>
        private Dictionary<float, int> GetSampleNumbersOfPerSegment()
        {
            Dictionary<float, int> result = new Dictionary<float, int>();

            List<float> segRightValue = new List<float>();//分片极右值
            foreach (var item in Demarcation)
            {
                segRightValue.Add(item);
            }
            segRightValue.Add(MaxExtremum);

            for (int i = 0; i < segRightValue.Count; i++)
            {
                int value = 0;
                foreach (float m in Samples)//计算每个片段的样本数
                {
                    if (i == 0)
                    {
                        if (m <= segRightValue[i])
                        {
                            value += 1;
                        }
                    }
                    else
                    {
                        if (m <= segRightValue[i] && m > segRightValue[i - 1])
                        {
                            value += 1;
                        }
                    }
                }

                result.Add(segRightValue[i], value);
            }
            return result;
        }

        /// <summary>
        /// 获取每个分片的左上顶点坐标
        /// </summary>
        /// <param name="UsableWidth">最大利用宽度</param>
        /// <param name="UsableHeight">最小利用宽度</param>
        /// <returns></returns>
        private List<PointF> GetTopLeftPointFOfSegment(PointF bottomLeft, float UsableWidth, float UsableHeight, out  float widthPerSeg, out  float unitHeight, out  Dictionary<float, int> SampleNumbersOfPerSegment)
        {
            List<PointF> result = new List<PointF>();

            SampleNumbersOfPerSegment = GetSampleNumbersOfPerSegment();//获取每个片段占有的样本数

            int maxSampleNumbersOfSegment = SampleNumbersOfPerSegment.Max(x => x.Value);//所有分片中 最大分片样本数

            widthPerSeg = UsableWidth * 1f / (SampleNumbersOfPerSegment.Count * 2 + 1);//每个分片的宽度  分片之间还有空白分片

            unitHeight = UsableHeight * 1f / maxSampleNumbersOfSegment;//充分利用高度的情况下 单位样本数所占高度


            for (int i = 0; i < SampleNumbersOfPerSegment.Count; i++)
            {
                PointF pf = new PointF();

                pf.X = bottomLeft.X + (i * 2 + 1) * widthPerSeg;//每个片段的左边X坐标

                pf.Y = bottomLeft.Y - SampleNumbersOfPerSegment.ElementAt(i).Value * unitHeight;//每个片段上边Y坐标

                result.Add(pf);
            }

            return result;
        }

        /// <summary>
        /// 获取每个分片的 条形数据(包括:左上角坐标,高度和宽度)
        /// </summary>
        /// <param name="UsableWidth"></param>
        /// <param name="UsableHeight"></param>
        /// <returns></returns>
        private RectangleF[] GetRectangleFs(PointF bottomLeft, float UsableWidth, float UsableHeight, out Dictionary<float, int> SampleNumbersOfPerSegment)
        {
            float widthPerSeg = 0;//每个片段的宽度

            float unitHeight = 0;//单位样本数据在Y轴上表示需要的高度

            //每个片段的左上角坐标
            List<PointF> pfs = GetTopLeftPointFOfSegment(bottomLeft, UsableWidth, UsableHeight, out widthPerSeg, out unitHeight, out SampleNumbersOfPerSegment);

            RectangleF[] RFs = new RectangleF[pfs.Count];


            for (int i = 0; i < pfs.Count; i++)
            {
                //通过计算宽度和高度 结合左上角坐标 以准确描述每个矩形的大小和位置
                RFs[i] = new RectangleF(pfs[i], new SizeF(widthPerSeg, SampleNumbersOfPerSegment.ElementAt(i).Value * unitHeight));
            }

            return RFs;
        }

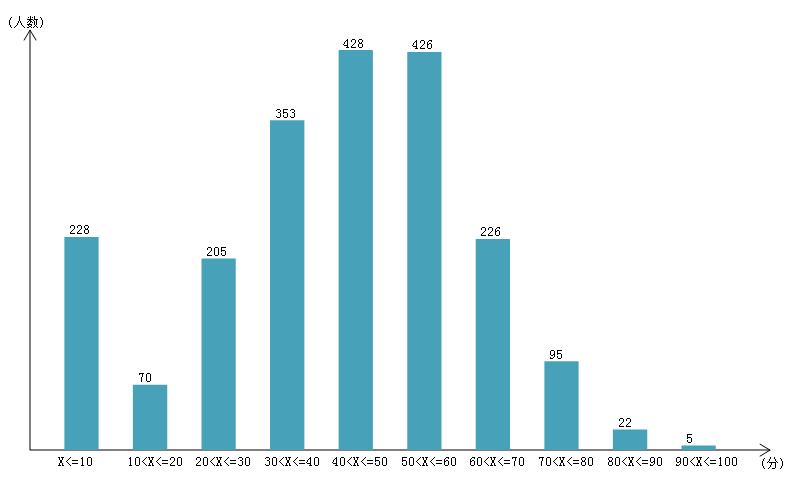
        /// <summary>
        /// 获得10段柱状图
        /// 横轴 分数段;纵轴 该分数段的 人数
        /// </summary>
        /// <param name="width"></param>
        /// <param name="heigh"></param>
        /// <param name="unitName"></param>
        /// <param name="familyName"></param>
        /// <returns></returns>
        public Bitmap GetBargraph(int width, int heigh, string XunitName, string YunitName, string familyName = "宋体")
        {
            Font font = new Font(familyName, 10);

            Bitmap bitmap = new Bitmap(width, heigh);
            Graphics gdi = Graphics.FromImage(bitmap);
            //用白色填充整个图片,因为默认是黑色
            gdi.Clear(Color.White);
            //抗锯齿
            gdi.SmoothingMode = SmoothingMode.HighQuality;
            //高质量的文字
            gdi.TextRenderingHint = TextRenderingHint.ClearTypeGridFit;
            //像素均偏移0.5个单位,以消除锯齿
            gdi.PixelOffsetMode = PixelOffsetMode.Half;


            int margin = 30;//坐标轴与边框的距离
            int padding = 20;//实际表示内容区域 与坐标轴右和上边的距离

            PointF bottomLeft = new PointF(margin, heigh - margin);//坐标原点


            PointF topLeft = new PointF(bottomLeft.X, margin);//Y轴最上顶端坐标

            PointF topLeft_bl = new PointF(topLeft.X - 6, topLeft.Y + 10);//Y轴箭头左下端坐标

            PointF topLeft_br = new PointF(topLeft.X + 6, topLeft_bl.Y);//Y轴箭头右下端坐标

            gdi.DrawLines(Pens.Black, new PointF[] { topLeft_bl, topLeft, topLeft_br });//画坐标轴Y轴箭头

            gdi.DrawString(string.Format("({0})", YunitName), font, Brushes.Black, topLeft_bl.X - 20, topLeft.Y - 14);//在Y轴箭头左下角写上 Y轴表示的单位

            PointF bottomRight = new PointF(width - margin, bottomLeft.Y);//X轴最右端坐标

            PointF bottomRight_lt = new PointF(bottomRight.X - 10, bottomRight.Y - 6);//X轴箭头左上端坐标

            PointF bottomRight_lb = new PointF(bottomRight_lt.X, bottomRight.Y + 6);//X轴箭头右下端坐标

            gdi.DrawLines(Pens.Black, new PointF[] { bottomRight_lt, bottomRight, bottomRight_lb });//画坐标轴X轴箭头

            gdi.DrawString(string.Format("({0})", XunitName), font, Brushes.Black, bottomRight_lt.X - 3, bottomRight_lt.Y + 13);//在X轴箭头的下方 写上X轴表示的单位

            gdi.DrawLines(Pens.Black, new PointF[] { topLeft, bottomLeft, bottomRight });//画坐标轴

            float usableHeight = bottomLeft.Y - margin - padding;//内容区高度

            float usableWidth = width - margin * 2 - padding;//内容区宽度

            Dictionary<float, int> SampleNumbersOfPerSegment = null;//各个片段的描述数据

            RectangleF[] RFs = GetRectangleFs(bottomLeft, usableWidth, usableHeight, out SampleNumbersOfPerSegment);//获取条形图位置数据

            gdi.FillRectangles(new SolidBrush(Color.FromArgb(70, 161, 185)), RFs);//填充柱形


            //标上坐标轴上的数据

            //X轴上写的内容
            string Xcontent = string.Empty;
            //条形顶上方写的内容
            string Ycontent = string.Empty;
            for (int i = 0; i < SampleNumbersOfPerSegment.Count; i++)
            {
                if (i == 0)
                    Xcontent = "X<=" + SampleNumbersOfPerSegment.ElementAt(i).Key.ToString("F0");
                else
                {
                    Xcontent = string.Format("{0}<X<={1}", SampleNumbersOfPerSegment.ElementAt(i - 1).Key.ToString("F0"), SampleNumbersOfPerSegment.ElementAt(i).Key.ToString("F0"));
                }

                gdi.DrawString(Xcontent, font, Brushes.Black, RFs[i].X - 8, bottomLeft.Y + 5); //写上X轴上的数据

                Ycontent = SampleNumbersOfPerSegment.ElementAt(i).Value.ToString();

                gdi.DrawString(Ycontent, font, Brushes.Black, RFs[i].X + 3, RFs[i].Y - 13); //写上Y轴上的数据

            }


            return bitmap;
        }


    }
调用:
 StatisticsGraph sg = new StatisticsGraph(scores.ConvertAll(x => (float)x),10,100);
            System.Diagnostics.Stopwatch w = new System.Diagnostics.Stopwatch();
            w.Start();
            Bitmap bitmap = sg.GetBargraph(800, 480,"分","人数");
            bitmap.Save("tt.jpg", System.Drawing.Imaging.ImageFormat.Jpeg);
            Debug.WriteLine(w.Elapsed);
一张图片大约耗时20毫秒。
测试数据得到的柱形图:
