进入http://cistrome.org/db/#/数据库
输入你感兴趣的转录因子,比如HDAC1
选择物种,以及你感兴趣的cell type
点击可以查询”check a putative target“
也可以下载全部的”Putative Target“
最后个性化绘图
总结:
适合辅助分析,提供额外的fancy的证据,还是有一定的power的。
绘图代码:
library(ggplot2)
library(RColorBrewer)

Hdac1.chipseq.1 <- read.csv("ChIPseq/Hdac1_targets_mm_ESC_CR.txt", sep = "	", stringsAsFactors = F)
Hdac1.chipseq.1$humanGene <- toupper(Hdac1.chipseq.1$symbol)
Hdac1.chipseq.1$cellLine <- "mm_ESC_CR"
Hdac1.chipseq.1$CellType <- "Embryonic Stem Cell"

Hdac1.chipseq <- rbind(Hdac1.chipseq.1, Hdac1.chipseq.2, Hdac1.chipseq.3, Hdac1.chipseq.4, Hdac1.chipseq.5)
dim(Hdac1.chipseq)

# sort score
Hdac1.chipseq <- Hdac1.chipseq[order(Hdac1.chipseq$score, decreasing = T),]

# remove duplicates
Hdac1.chipseq <- Hdac1.chipseq[!duplicated(Hdac1.chipseq[,c("chrom","symbol","cellLine")]),]

core.risk.genes <- c("GLI3","BCL11A","FOXO1","HEY1","HEY2","SOX11","ASCL1","TUBB3","TFAP2A","NR2F2")

Hdac1.chipseq.core <- subset(Hdac1.chipseq, humanGene %in% core.risk.genes & score > 0)

Hdac1.chipseq.core$humanGene <- factor(Hdac1.chipseq.core$humanGene, levels = unique(Hdac1.chipseq.core$humanGene))
Hdac1.chipseq.core$CellType <- factor(Hdac1.chipseq.core$CellType, levels = c("iPSC", "Embryonic Stem Cell", "Embryonic Fibroblast Cell", "Epithelium"))

options(repr.plot.width=7, repr.plot.height=5)
p <- ggplot(Hdac1.chipseq.core, aes(x=humanGene, y=score, color=CellType)) +
  # facet_wrap(~variable, ncol = 3) +
  theme_bw() +
  # geom_violin(trim=T, scale="width") + # aes(fill=group) # width, area, count
  # geom_boxplot() +
  geom_jitter(position=position_jitter(0),aes(fill=CellType),shape = 21,colour = "grey50",size = 4,stroke = 1) +
  labs(title="HDAC1",x="", y = "Score from ChIP-seq") +
  # theme(legend.title=element_blank()) +
  # just remove inside grid
  theme(panel.grid.major = element_blank(), panel.grid.minor = element_blank()) +
  # remove top and right border
  theme(axis.line = element_line(colour = "black"), panel.grid.major = element_blank(),
    panel.grid.minor = element_blank(), panel.border = element_blank(), panel.background = element_blank()) +
  # force y start from 0
  # scale_y_continuous(expand = c(0, 0), limits = c(-0.3, 11.5)) +
  # title position
  theme(plot.title = element_text(hjust = 0.5, face = "italic", size=20)) +
  ##
  theme(# legend.position = "none",
        axis.text.x = element_text(angle = 60, size = 12, vjust = 0.5, face = "italic"),
        axis.title.y = element_text(size = 16)) +
  scale_color_manual(values=brewer.pal(8,"Set1")) +
  scale_fill_manual(values=brewer.pal(8,"Set1"))
p

ggsave(filename = "../manuscript/HDAC1.target.score.pdf", width = 7, height = 5)
成品图
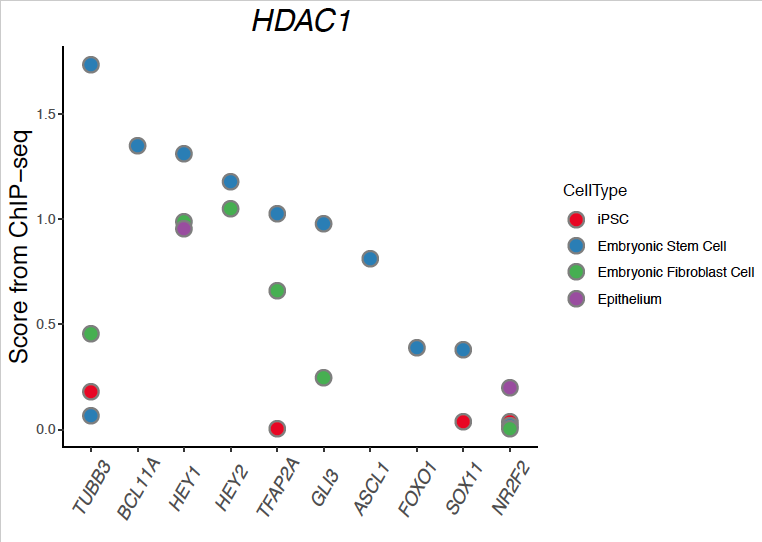
看着还不错吧,可以扯上一扯。
参考目录:human/singleCell/HSCR/HDAC/HDAC.ipynb