好了,今天接着来学习性能,在今天开始前,我今天在网上又看到了理发师经典模型,这里稍微提一下,详情可以百度哈,下面这张图是网上找到的经典场景性能相关的图,大致说明下:
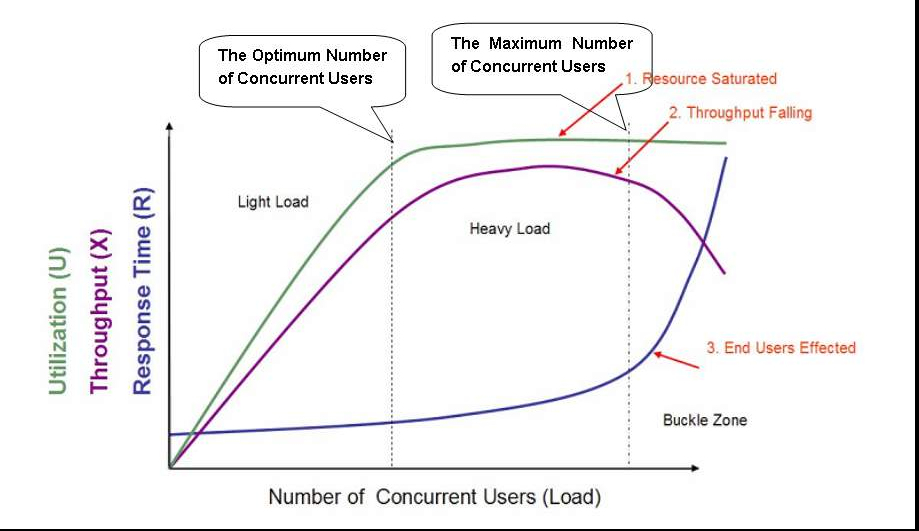
这张图中展示的是1个标准的软件性能模型。在图中有三条曲线,分别表示资源的利用情况(Utilization,包括硬件资源和软件资源)、吞吐量(Throughput,这里是指每秒事务数)以及响应时间(Response Time)。图中坐标轴的横轴从左到右表现了并发用户数(Number of Concurrent Users)的不断增长。
在这张图中我们可以看到,最开始,随着并发用户数的增长,资源占用率和吞吐量会相应的增长,但是响应时间的变化不大;不过当并发用户数增长到一定程度后,资源占用达到饱和,吞吐量增长明显放缓甚至停止增长,而响应时间却进一步延长。如果并发用户数继续增长,你会发现软硬件资源占用继续维持在饱和状态,但是吞吐量开始下降,响应时间明显的超出了用户可接受的范围,并且最终导致用户放弃了这次请求甚至离开。
根据这种性能表现,图中划分了三个区域,分别是Light Load(较轻的压力)、Heavy Load(较重的压力)和Buckle Zone(用户无法忍受并放弃请求)。在Light Load和Heavy Load 两个区域交界处的并发用户数,我们称为“最佳并发用户数(The Optimum Number of Concurrent Users)”,而Heavy Load和Buckle Zone两个区域交界处的并发用户数则称为“最大并发用户数(The Maximum Number of Concurrent Users)”。
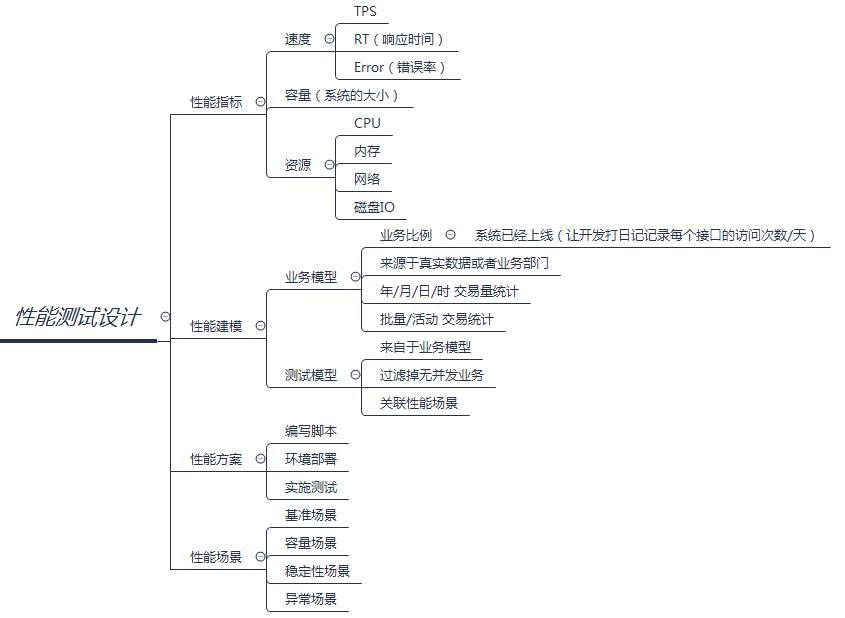
我们在进行性能测试时,首先需要确定的就是性能指标,然后开始性能建模,接着确定性能方案,最后进行性能场景。
下面是性能测试的大致过程:
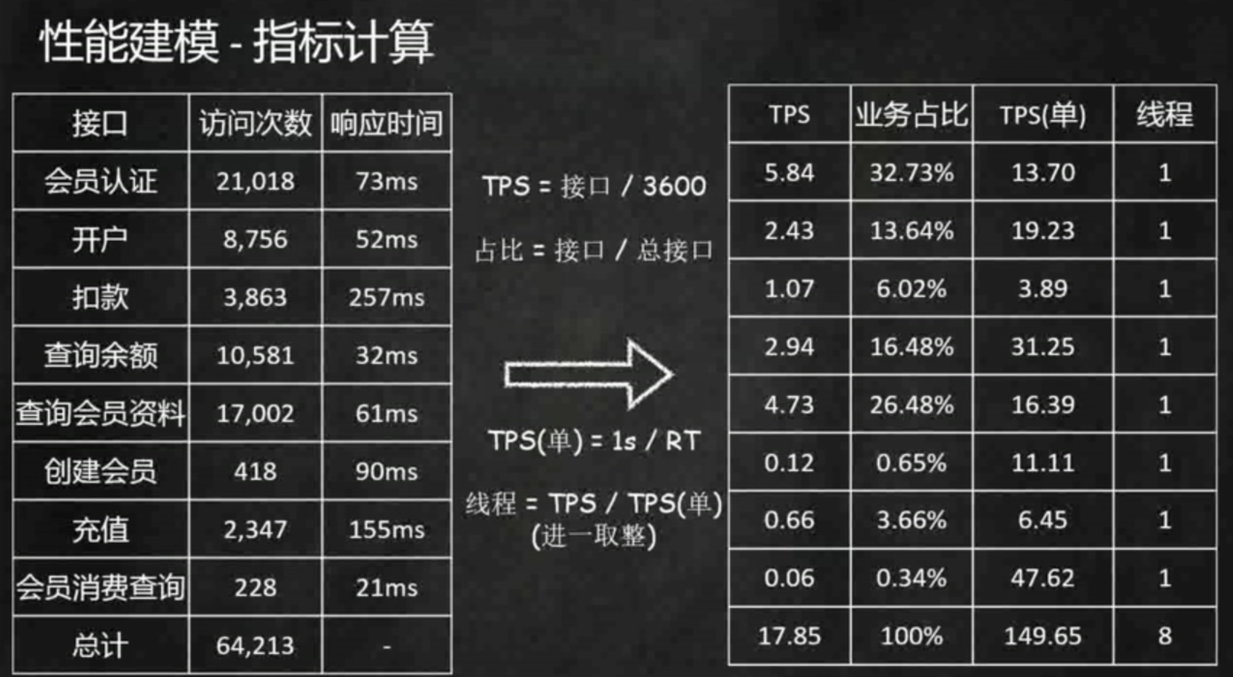
下面是性能建模的各个接口单个小时的指标计算,最后发现单个线程就能满足TPS了。(所以说用户不等于线程数)
上面稍微提了一下性能的过程和指标计算,这些会在后面详细讲解,今天的主要目的实际上是来做性能监控的,性能监控的数据我们用influxdb进行保存,然后数据展示用grafana。
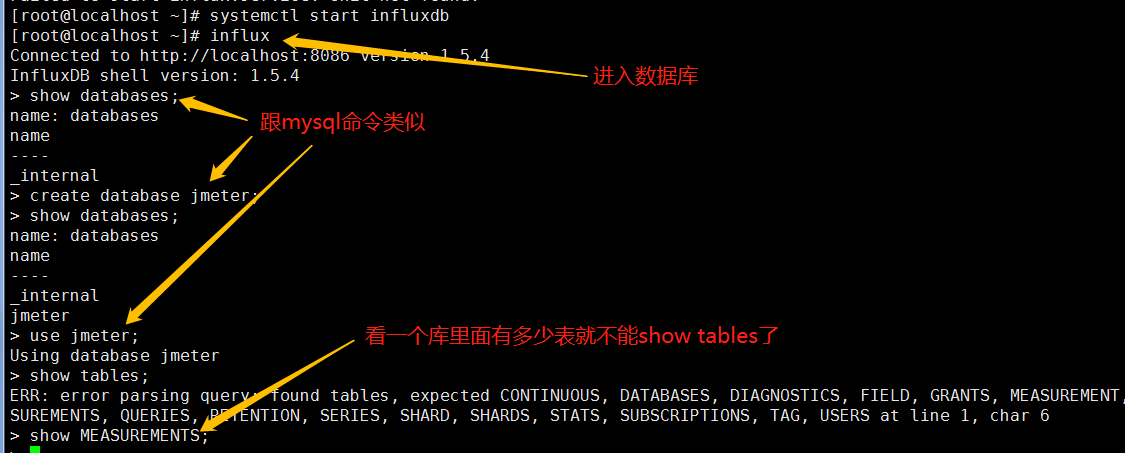
- 这里我们先来安装下influxdb,influxdb 1.5.4 下载地址 :https://www.influxdata.com/ , 下载之后通过yum localinstall安装rpm包(跟着官网干的)
下图是启动influxdb然后通过influx命令进入influxdb数据库,创建jmeter数据库,show MEASURENENTS (这个是查看所有键)。在页面上可以试着访问下ip+8086,如果出现404 page not found证明OK,因为是通用http请求的。
- 创建一个新的管理员用户
CREATE USER <username> WITH PASSWORD '<password>' WITH ALL PRIVILEGES
- 为一个已有用户授权管理员权限
GRANT ALL PRIVILEGES TO <username>
2.安装grafana,下载地址:https://grafana.com/grafana/download,下载之后通过yum localinstall安装rpm包。
安装完成后启动服务:systemctl start grafana-server,记住要关闭防火墙喔,systemctl stop firewalld(临时关闭)和systemctl disable firewalld(禁止开机启动)
然后访问,ip+3000端口,默认用户名和密码是admin;
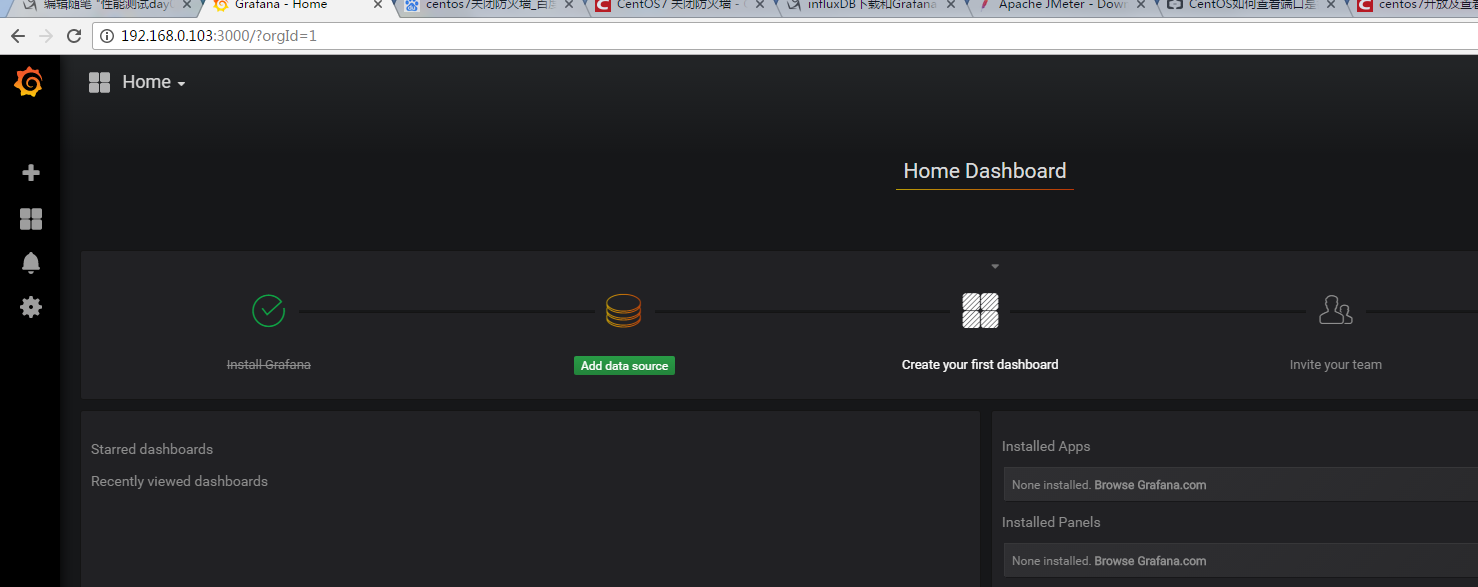
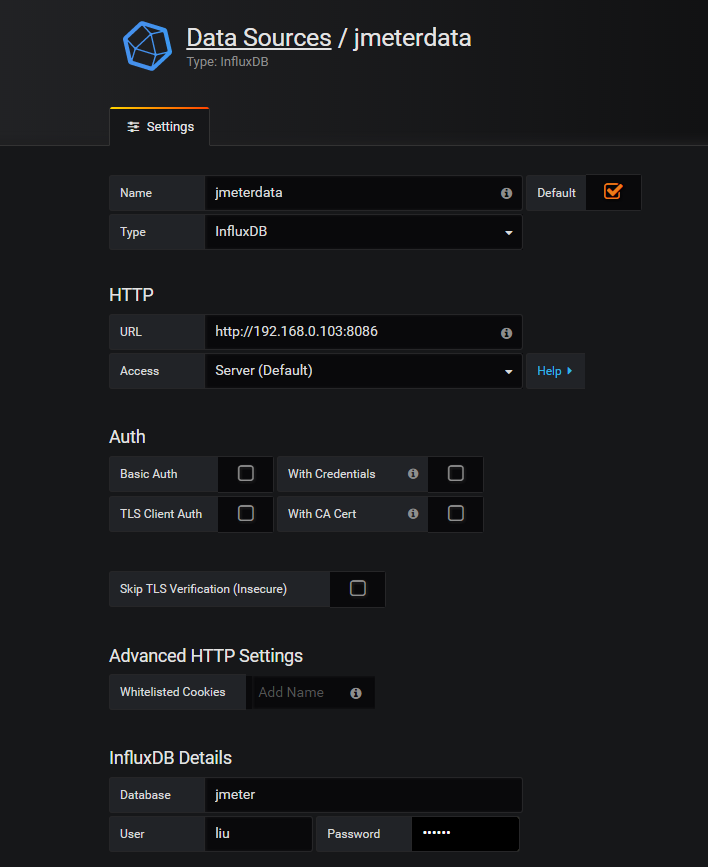
安装好了grafana之后,我们可以配置一下grafana从influxdb中读取数据,从设置->Data Sources然后进行如下的配置:
3.配置完后,我们可以通过jmeter通过Backend Listener将测试的数据写入influxdb的jmeter表中,如下图:这里用三个java请求跑一下看下效果

我们可以查询看下jmeter表里面有哪些字段及意思:
time              时间戳
application        jmeter中指定的application的名称
avg                平均响应时间
count            所有产生东西的统计
countError        错误统计
endedT            结束的线程
hit
max              最大的响应时间
maxAT              最大的活动线程数
meanAT
min                最小的响应时间
minAT
pct90.0            90%的响应时间
pct95.0            95%的响应时间
pct99.0            99%的响应时间
startedT           开始的线程
statut             状态
transaction        事务
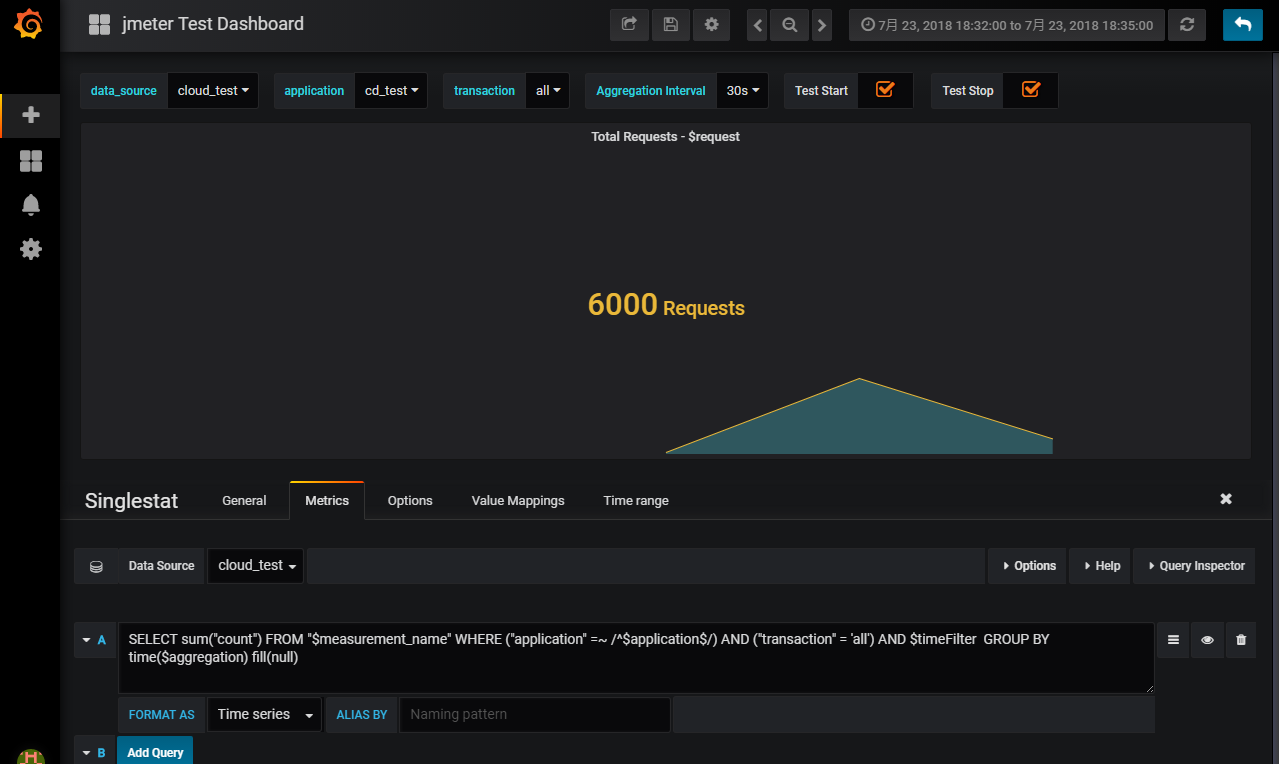
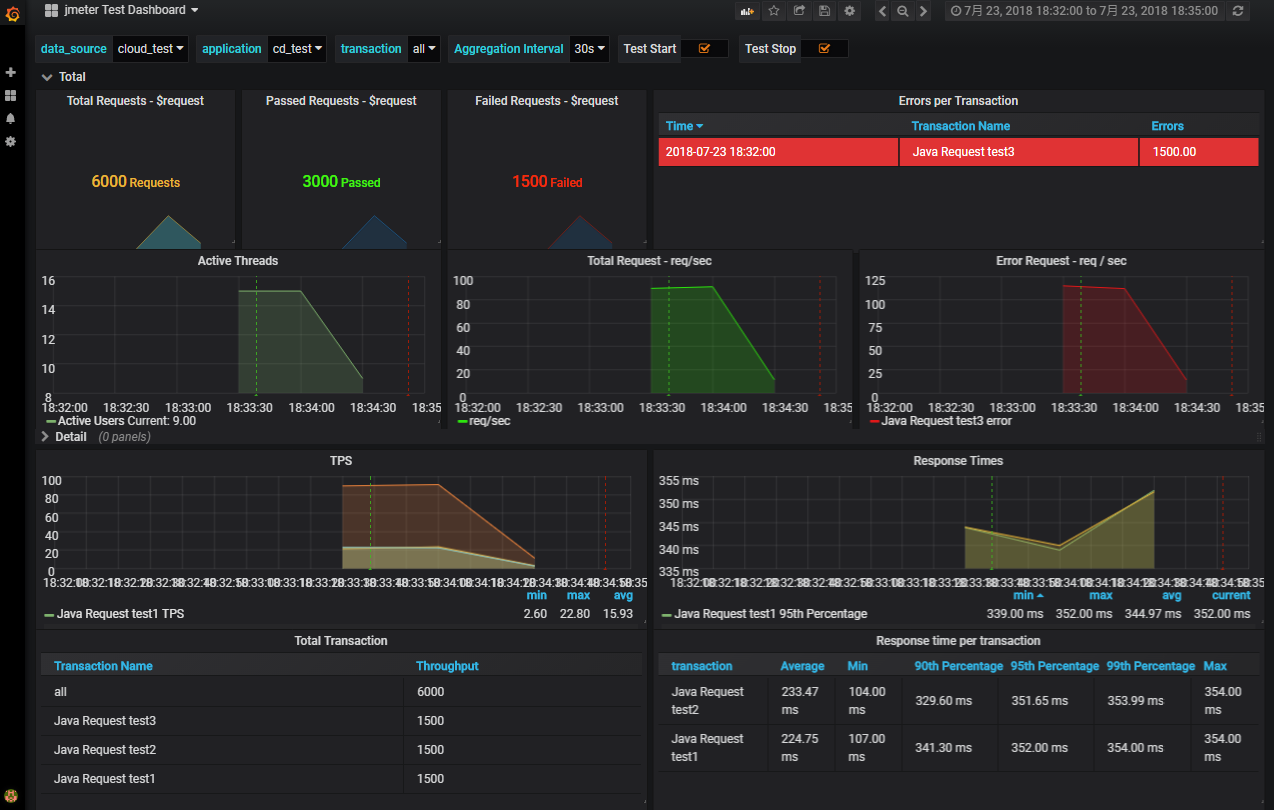
4.我们通过New dashboard -> add -> Singlestat来添加刚刚的请求数,刚刚15个线程跑三个java请求各100次,应该是4500次,但是因为两个请求又包成了一层事务,所以总的请求次数为6000:
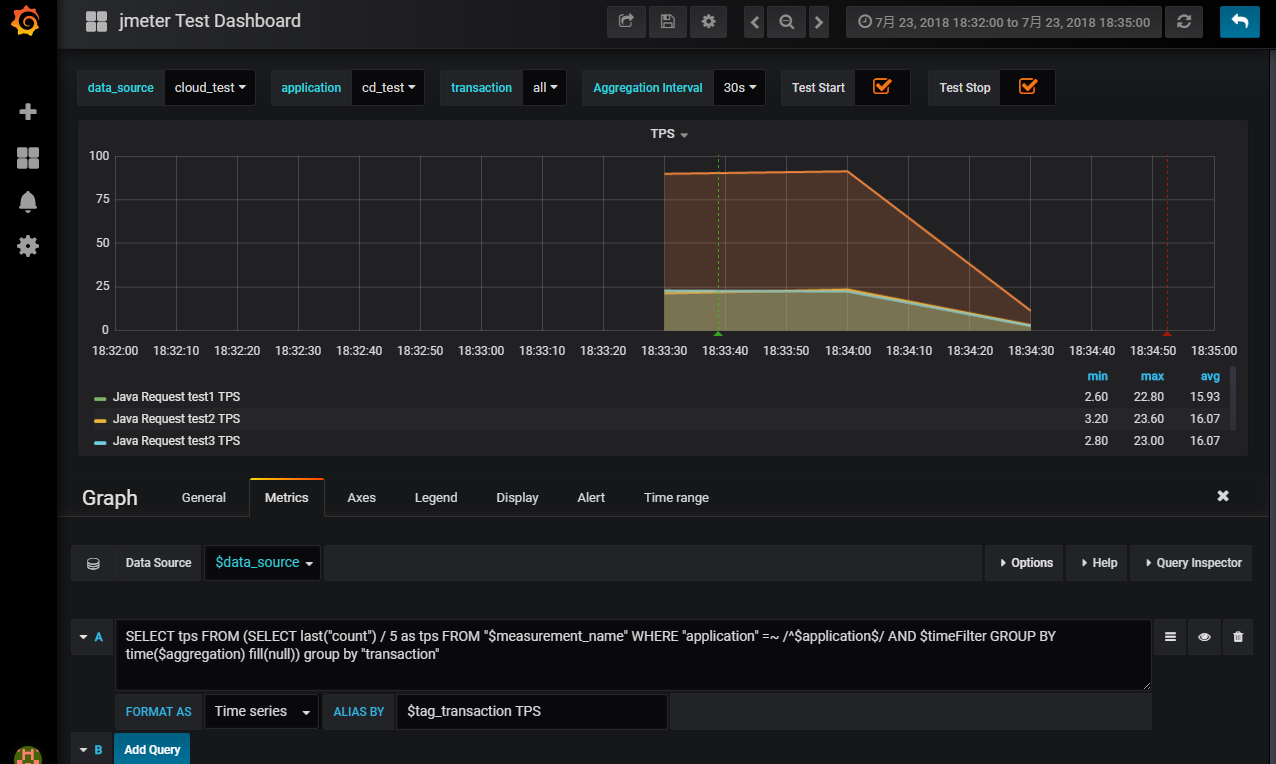
下图是三个请求的TPS:
最终模仿着别人的写出来了自己的模板,效果如下:
如果需要源文件可以私撩我 ,对于添加各种数据图表的话,大家可以查看该地址:https://testerhome.com/topics/11256
5.上面是从jmeter结果中读取的数据,主要还是请求性能的参数指标,那么我们在真正的性能测试过程中,我们经常还需要统计服务器的资源使用情况,那么这个时候我们怎么将服务器的资源使用情况也写进来呢?
我们可以查看influxdb官网的API接口,通过curl -i -XPOST http://localhost:8086/query --data-urlencode "q=CREATE DATABASE mydb"可以创建mydb数据库
然后我们可以先将监控数据保存在txt文档内,最后再将txt监控数据写入到influxdb数据库中,最终通过grafana展示出来。
写入influxdb数据库的命令:
curl -i -XPOST 'http://localhost:8086/write?db=mydb' --data-binary 'cpu_load_short,host=server01,region=us-west value=0.64 1434055562000000000'- 或:curl -i -XPOST 'http://localhost:8086/write?db=mydb' --data-binary @cpu_data.txt
对于linux的指标监控我们用的是vmstat,这里来简单说明一下各个字段的意思:

字段说明:
Procs(进程)
- r:运行队列中进程数量,以8核为例,如果队列数量超过8,证明有排队的,但这不代表压力很大,因为很快就能处理完了,如果该参数长期大于和等于逻辑cpu个数,则CPU资源可能存在较大的瓶颈。
- b: 等待IO的进程数量。意味着进程被阻塞。主要是指被资源阻塞的进程对列数(比如IO资源、页面调度等),当这个值较大时,需要根据应用程序来进行分析
Memory(内存)
- swpd: 使用虚拟内存大小,如果swpd的值不为0,但是SI,SO的值长期为0,这种情况不会影响系统性能。
- free: 空闲物理内存大小。
- buff: 用作缓冲的内存大小。
- cache: 用作缓存的内存大小,如果cache的值大的时候,说明cache处的文件数多,如果频繁访问到的文件都能被cache处,那么磁盘的读IO bi会非常小。
Swap
- si: 每秒从交换区写到内存的大小,由磁盘调入内存。
- so: 每秒写入交换区的内存大小,由内存调入磁盘。
注意:内存够用的时候,这2个值都是0,如果这2个值长期大于0时,系统性能会受到影响,磁盘IO和CPU资源都会被消耗。有些朋友看到空闲内存(free)很少的或接近于0时,就认为内存不够用了,不能光看这一点,还要结合si和so,如果free很少,但是si和so也很少(大多时候是0),那么不用担心,系统性能这时不会受到影响的。
IO(现在的Linux版本块的大小为1kb)
- bi: 每秒读取的块数
- bo: 每秒写入的块数
注意:随机磁盘读写的时候,这2个值越大(如超出1024k),能看到CPU在IO等待的值也会越大。
system(系统)
- in: 每秒中断数,包括时钟中断。(分为软中断(访问应用软件超时等)和硬中断(访问硬件报错,硬中断+1))
- cs: 每秒上下文切换数。(进程和线程的交互,经验来讲,2C4G最好小于2W次,4C8G在6W~8W,8核16G是在20W到30W)
注意:上面2个值越大,会看到由内核消耗的CPU时间会越大。
CPU(以百分比表示)
- us: 用户进程执行时间百分比(user time)
us的值比较高时,说明用户进程消耗的CPU时间多,但是如果长期超50%的使用,那么我们就该考虑优化程序算法或者进行加速。
- sy: 内核系统进程执行时间百分比(system time)
sy的值高时,说明系统内核消耗的CPU资源多,这并不是良性表现,我们应该检查原因。
- id: 空闲时间百分比
- wa: IO等待时间百分比
wa的值高时,说明IO等待比较严重,这可能由于磁盘大量作随机访问造成,也有可能磁盘出现瓶颈(块操作)。
- st: 当虚拟机1资源不够的时候会去偷宿主机资源(宿主机资源不够情况可以再去虚拟机2拿),最终给虚拟机1,这个过程就是st
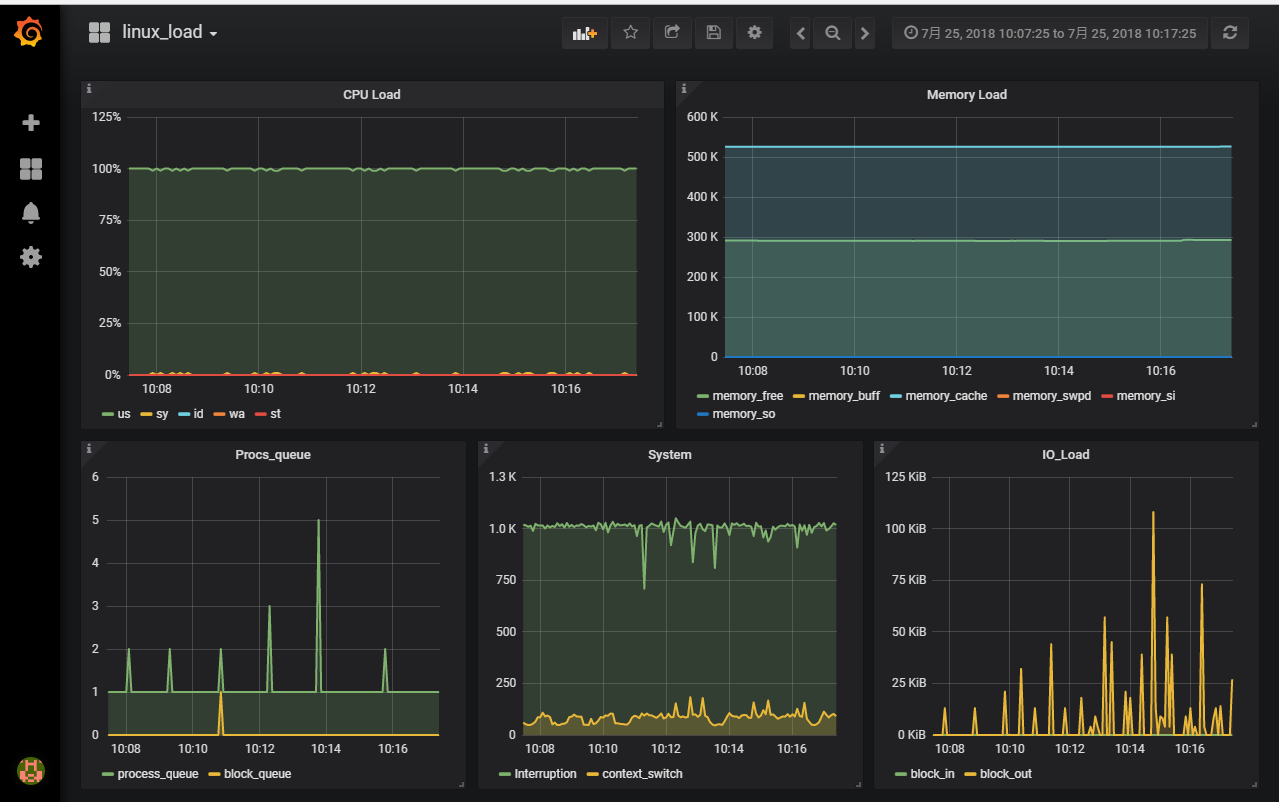
6.字段说明完了之后,我们就来写shell脚本通过vmstat去收集数据然后再插入influxdb数据库中,最后再从grafana中通过sql语句读取出数据展现在图表中。
首先,我先写个sh文件,通过vmstat收集数据然后post到influxdb中,sh脚本内容如下:
#!/bin/bash
while true;do
    value=`vmstat 1 2|tail -n 1`
    vm_r=`echo $value|cut -d " " -f1`
    vm_b=`echo $value|cut -d " " -f2`
    vm_swpd=`echo $value|cut -d " " -f3`
    vm_free=`echo $value|cut -d " " -f4`
    vm_buff=`echo $value|cut -d " " -f5`
    vm_cache=`echo $value|cut -d " " -f6`
    vm_si=`echo $value|cut -d " " -f7`
    vm_so=`echo $value|cut -d " " -f8`
    vm_bi=`echo $value|cut -d " " -f9`
    vm_bo=`echo $value|cut -d " " -f10`
    vm_in=`echo $value|cut -d " " -f11`
    vm_cs=`echo $value|cut -d " " -f12`
    vm_us=`echo $value|cut -d " " -f13`
    vm_sy=`echo $value|cut -d " " -f14`
    vm_id=`echo $value|cut -d " " -f15`
    vm_wa=`echo $value|cut -d " " -f16`
    vm_st=`echo $value|cut -d " " -f17`

    ip=`ip addr |grep eno16777736|tail -n 1|awk '{print $2}'|awk -F '/' '{ print $1}'`

    curl -i -XPOST "http://10.10.18.131:8086/write?db=vmstat" --data-binary "linux_load_count,ip=$ip r=$vm_r
    linux_load_count,ip=$ip b=$vm_b
    linux_load_count,ip=$ip swpd=$vm_swpd
    linux_load_count,ip=$ip free=$vm_free
    linux_load_count,ip=$ip buff=$vm_buff
    linux_load_count,ip=$ip cache=$vm_cache
    linux_load_count,ip=$ip si=$vm_si
    linux_load_count,ip=$ip so=$vm_so
    linux_load_count,ip=$ip bi=$vm_bi
    linux_load_count,ip=$ip bo=$vm_bo
    linux_load_count,ip=$ip in=$vm_in
    linux_load_count,ip=$ip cs=$vm_cs
    linux_load_count,ip=$ip us=$vm_us
    linux_load_count,ip=$ip sy=$vm_sy
    linux_load_count,ip=$ip id=$vm_id
    linux_load_count,ip=$ip wa=$vm_wa
    linux_load_count,ip=$ip st=$vm_st"

sleep 3
done
推送完成后,我们就去grafana写sql展示(记得新建一个data source),效果图如下:
其实不是很难,我把这个模板的json贴出来,有兴趣的可以一起深入研究研究。
下面是linux监控的json模板:
{
"__inputs": [
{
"name": "DS_VMSTAT",
"label": "vmstat",
"description": "",
"type": "datasource",
"pluginId": "influxdb",
"pluginName": "InfluxDB"
}
],
"__requires": [
{
"type": "grafana",
"id": "grafana",
"name": "Grafana",
"version": "5.2.1"
},
{
"type": "panel",
"id": "graph",
"name": "Graph",
"version": "5.0.0"
},
{
"type": "datasource",
"id": "influxdb",
"name": "InfluxDB",
"version": "5.0.0"
}
],
"annotations": {
"list": [
{
"builtIn": 1,
"datasource": "-- Grafana --",
"enable": true,
"hide": true,
"iconColor": "rgba(0, 211, 255, 1)",
"name": "Annotations & Alerts",
"type": "dashboard"
}
]
},
"description": "监控linux机器的资源使用情况",
"editable": true,
"gnetId": null,
"graphTooltip": 0,
"id": null,
"links": [],
"panels": [
{
"aliasColors": {},
"bars": false,
"dashLength": 10,
"dashes": false,
"datasource": "${DS_VMSTAT}",
"description": "us: 用户进程执行时间百分比(user time)
us的值比较高时,说明用户进程消耗的CPU时间多,但是如果长期超50%的使用,那么我们就该考虑优化程序算法或者进行加速。
sy: 内核系统进程执行时间百分比(system time)
sy的值高时,说明系统内核消耗的CPU资源多,这并不是良性表现,我们应该检查原因。
id: 空闲时间百分比
wa: IO等待时间百分比
wa的值高时,说明IO等待比较严重,这可能由于磁盘大量作随机访问造成,也有可能磁盘出现瓶颈(块操作)。
st: 当虚拟机1资源不够的时候会去偷宿主机资源(宿主机资源不够情况可以再去虚拟机2拿),最终给虚拟机1,这个过程就是st",
"fill": 2,
"gridPos": {
"h": 9,
"w": 12,
"x": 0,
"y": 0
},
"id": 2,
"legend": {
"avg": false,
"current": false,
"max": false,
"min": false,
"show": true,
"total": false,
"values": false
},
"lines": true,
"linewidth": 2,
"links": [],
"nullPointMode": "null",
"percentage": false,
"pointradius": 5,
"points": false,
"renderer": "flot",
"seriesOverrides": [],
"spaceLength": 10,
"stack": false,
"steppedLine": false,
"targets": [
{
"alias": "$col",
"groupBy": [
{
"params": [
"$__interval"
],
"type": "time"
},
{
"params": [
"null"
],
"type": "fill"
}
],
"orderByTime": "ASC",
"policy": "default",
"query": "SELECT us from linux_load_count WHERE $timeFilter fill(null)",
"rawQuery": true,
"refId": "A",
"resultFormat": "time_series",
"select": [
[
{
"params": [
"value"
],
"type": "field"
},
{
"params": [],
"type": "mean"
}
]
],
"tags": []
},
{
"alias": "$col",
"groupBy": [
{
"params": [
"$__interval"
],
"type": "time"
},
{
"params": [
"null"
],
"type": "fill"
}
],
"orderByTime": "ASC",
"policy": "default",
"query": "SELECT sy from linux_load_count WHERE $timeFilter fill(null)",
"rawQuery": true,
"refId": "B",
"resultFormat": "time_series",
"select": [
[
{
"params": [
"value"
],
"type": "field"
},
{
"params": [],
"type": "mean"
}
]
],
"tags": []
},
{
"alias": "$col",
"groupBy": [
{
"params": [
"$__interval"
],
"type": "time"
},
{
"params": [
"null"
],
"type": "fill"
}
],
"orderByTime": "ASC",
"policy": "default",
"query": "SELECT id from linux_load_count WHERE $timeFilter fill(null)",
"rawQuery": true,
"refId": "C",
"resultFormat": "time_series",
"select": [
[
{
"params": [
"value"
],
"type": "field"
},
{
"params": [],
"type": "mean"
}
]
],
"tags": []
},
{
"alias": "$col",
"groupBy": [
{
"params": [
"$__interval"
],
"type": "time"
},
{
"params": [
"null"
],
"type": "fill"
}
],
"orderByTime": "ASC",
"policy": "default",
"query": "SELECT wa from linux_load_count WHERE $timeFilter fill(null)",
"rawQuery": true,
"refId": "D",
"resultFormat": "time_series",
"select": [
[
{
"params": [
"value"
],
"type": "field"
},
{
"params": [],
"type": "mean"
}
]
],
"tags": []
},
{
"alias": "$col",
"groupBy": [
{
"params": [
"$__interval"
],
"type": "time"
},
{
"params": [
"null"
],
"type": "fill"
}
],
"orderByTime": "ASC",
"policy": "default",
"query": "SELECT st from linux_load_count WHERE $timeFilter fill(null)",
"rawQuery": true,
"refId": "E",
"resultFormat": "time_series",
"select": [
[
{
"params": [
"value"
],
"type": "field"
},
{
"params": [],
"type": "mean"
}
]
],
"tags": []
}
],
"thresholds": [],
"timeFrom": null,
"timeShift": null,
"title": "CPU Load",
"tooltip": {
"shared": true,
"sort": 0,
"value_type": "individual"
},
"type": "graph",
"xaxis": {
"buckets": null,
"mode": "time",
"name": null,
"show": true,
"values": []
},
"yaxes": [
{
"format": "percent",
"label": null,
"logBase": 1,
"max": null,
"min": null,
"show": true
},
{
"format": "short",
"label": null,
"logBase": 1,
"max": null,
"min": null,
"show": true
}
],
"yaxis": {
"align": false,
"alignLevel": null
}
},
{
"aliasColors": {},
"bars": false,
"dashLength": 10,
"dashes": false,
"datasource": "${DS_VMSTAT}",
"description": "swpd: 使用虚拟内存大小,如果swpd的值不为0,但是SI,SO的值长期为0,这种情况不会影响系统性能。
free: 空闲物理内存大小。
buff: 用作缓冲的内存大小。
cache: 用作缓存的内存大小,如果cache的值大的时候,说明cache处的文件数多,如果频繁访问到的文件都能被cache处,那么磁盘的读IO bi会非常小。
si: 每秒从交换区写到内存的大小,由磁盘调入内存。
so: 每秒写入交换区的内存大小,由内存调入磁盘.
注意:内存够用的时候,这2个值都是0,如果这2个值长期大于0时,系统性能会受到影响,磁盘IO和CPU资源都会被消耗。有些朋友看到空闲内存(free)很少的或接近于0时,就认为内存不够用了,不能光看这一点,还要结合si和so,如果free很少,但是si和so也很少(大多时候是0),那么不用担心,系统性能这时不会受到影响的。",
"fill": 2,
"gridPos": {
"h": 9,
"w": 12,
"x": 12,
"y": 0
},
"id": 4,
"legend": {
"avg": false,
"current": false,
"max": false,
"min": false,
"show": true,
"total": false,
"values": false
},
"lines": true,
"linewidth": 2,
"links": [],
"nullPointMode": "null",
"percentage": false,
"pointradius": 5,
"points": false,
"renderer": "flot",
"seriesOverrides": [],
"spaceLength": 10,
"stack": false,
"steppedLine": false,
"targets": [
{
"alias": "memory_$col",
"groupBy": [
{
"params": [
"$__interval"
],
"type": "time"
},
{
"params": [
"null"
],
"type": "fill"
}
],
"orderByTime": "ASC",
"policy": "default",
"query": "SELECT free from linux_load_count WHERE $timeFilter fill(null)",
"rawQuery": true,
"refId": "A",
"resultFormat": "time_series",
"select": [
[
{
"params": [
"value"
],
"type": "field"
},
{
"params": [],
"type": "mean"
}
]
],
"tags": []
},
{
"alias": "memory_$col",
"groupBy": [
{
"params": [
"$__interval"
],
"type": "time"
},
{
"params": [
"null"
],
"type": "fill"
}
],
"orderByTime": "ASC",
"policy": "default",
"query": "SELECT buff from linux_load_count WHERE $timeFilter fill(null)",
"rawQuery": true,
"refId": "B",
"resultFormat": "time_series",
"select": [
[
{
"params": [
"value"
],
"type": "field"
},
{
"params": [],
"type": "mean"
}
]
],
"tags": []
},
{
"alias": "memory_$col",
"groupBy": [
{
"params": [
"$__interval"
],
"type": "time"
},
{
"params": [
"null"
],
"type": "fill"
}
],
"orderByTime": "ASC",
"policy": "default",
"query": "SELECT cache from linux_load_count WHERE $timeFilter fill(null)",
"rawQuery": true,
"refId": "C",
"resultFormat": "time_series",
"select": [
[
{
"params": [
"value"
],
"type": "field"
},
{
"params": [],
"type": "mean"
}
]
],
"tags": []
},
{
"alias": "memory_$col",
"groupBy": [
{
"params": [
"$__interval"
],
"type": "time"
},
{
"params": [
"null"
],
"type": "fill"
}
],
"orderByTime": "ASC",
"policy": "default",
"query": "SELECT swpd from linux_load_count WHERE $timeFilter fill(null)",
"rawQuery": true,
"refId": "D",
"resultFormat": "time_series",
"select": [
[
{
"params": [
"value"
],
"type": "field"
},
{
"params": [],
"type": "mean"
}
]
],
"tags": []
},
{
"alias": "memory_$col",
"groupBy": [
{
"params": [
"$__interval"
],
"type": "time"
},
{
"params": [
"null"
],
"type": "fill"
}
],
"orderByTime": "ASC",
"policy": "default",
"query": "SELECT si from linux_load_count WHERE $timeFilter fill(null)",
"rawQuery": true,
"refId": "E",
"resultFormat": "time_series",
"select": [
[
{
"params": [
"value"
],
"type": "field"
},
{
"params": [],
"type": "mean"
}
]
],
"tags": []
},
{
"alias": "memory_$col",
"groupBy": [
{
"params": [
"$__interval"
],
"type": "time"
},
{
"params": [
"null"
],
"type": "fill"
}
],
"orderByTime": "ASC",
"policy": "default",
"query": "SELECT so from linux_load_count WHERE $timeFilter fill(null)",
"rawQuery": true,
"refId": "F",
"resultFormat": "time_series",
"select": [
[
{
"params": [
"value"
],
"type": "field"
},
{
"params": [],
"type": "mean"
}
]
],
"tags": []
}
],
"thresholds": [],
"timeFrom": null,
"timeShift": null,
"title": "Memory Load",
"tooltip": {
"shared": true,
"sort": 0,
"value_type": "individual"
},
"type": "graph",
"xaxis": {
"buckets": null,
"mode": "time",
"name": null,
"show": true,
"values": []
},
"yaxes": [
{
"format": "short",
"label": null,
"logBase": 1,
"max": null,
"min": null,
"show": true
},
{
"format": "short",
"label": null,
"logBase": 1,
"max": null,
"min": null,
"show": true
}
],
"yaxis": {
"align": false,
"alignLevel": null
}
},
{
"aliasColors": {},
"bars": false,
"dashLength": 10,
"dashes": false,
"datasource": "${DS_VMSTAT}",
"description": "r:运行队列中进程数量,以8核为例,如果队列数量超过8,证明有排队的,但这不代表压力很大,因为很快就能处理完了,如果该参数长期大于和等于逻辑cpu个数,则CPU资源可能存在较大的瓶颈。
b: 等待IO的进程数量。意味着进程被阻塞。主要是指被资源阻塞的进程对列数(比如IO资源、页面调度等),当这个值较大时,需要根据应用程序来进行分析",
"fill": 2,
"gridPos": {
"h": 9,
"w": 8,
"x": 0,
"y": 9
},
"id": 10,
"legend": {
"avg": false,
"current": false,
"max": false,
"min": false,
"show": true,
"total": false,
"values": false
},
"lines": true,
"linewidth": 2,
"links": [],
"nullPointMode": "null",
"percentage": false,
"pointradius": 5,
"points": false,
"renderer": "flot",
"seriesOverrides": [],
"spaceLength": 10,
"stack": false,
"steppedLine": false,
"targets": [
{
"alias": "$col",
"groupBy": [
{
"params": [
"$__interval"
],
"type": "time"
},
{
"params": [
"null"
],
"type": "fill"
}
],
"orderByTime": "ASC",
"policy": "default",
"query": "select "r" as process_queue from linux_load_count WHERE $timeFilter fill(null)",
"rawQuery": true,
"refId": "A",
"resultFormat": "time_series",
"select": [
[
{
"params": [
"value"
],
"type": "field"
},
{
"params": [],
"type": "mean"
}
]
],
"tags": []
},
{
"alias": "$col",
"groupBy": [
{
"params": [
"$__interval"
],
"type": "time"
},
{
"params": [
"null"
],
"type": "fill"
}
],
"orderByTime": "ASC",
"policy": "default",
"query": "select "b" as block_queue from linux_load_count WHERE $timeFilter fill(null)",
"rawQuery": true,
"refId": "B",
"resultFormat": "time_series",
"select": [
[
{
"params": [
"value"
],
"type": "field"
},
{
"params": [],
"type": "mean"
}
]
],
"tags": []
}
],
"thresholds": [],
"timeFrom": null,
"timeShift": null,
"title": "Procs_queue",
"tooltip": {
"shared": true,
"sort": 0,
"value_type": "individual"
},
"type": "graph",
"xaxis": {
"buckets": null,
"mode": "time",
"name": null,
"show": true,
"values": []
},
"yaxes": [
{
"format": "short",
"label": null,
"logBase": 1,
"max": null,
"min": null,
"show": true
},
{
"format": "short",
"label": null,
"logBase": 1,
"max": null,
"min": null,
"show": true
}
],
"yaxis": {
"align": false,
"alignLevel": null
}
},
{
"aliasColors": {},
"bars": false,
"dashLength": 10,
"dashes": false,
"datasource": "${DS_VMSTAT}",
"description": "in: 每秒中断数,包括时钟中断。(分为软中断(访问应用软件超时等)和硬中断(访问硬件报错,硬中断+1))
cs: 每秒上下文切换数。(进程和线程的交互,经验来讲,2C4G最好小于2W次,4C8G在6W~8W,8核16G是在20W到30W)
注意:上面2个值越大,会看到由内核消耗的CPU时间会越大。",
"fill": 2,
"gridPos": {
"h": 9,
"w": 8,
"x": 8,
"y": 9
},
"id": 8,
"legend": {
"avg": false,
"current": false,
"max": false,
"min": false,
"show": true,
"total": false,
"values": false
},
"lines": true,
"linewidth": 2,
"links": [],
"nullPointMode": "null",
"percentage": false,
"pointradius": 5,
"points": false,
"renderer": "flot",
"seriesOverrides": [],
"spaceLength": 10,
"stack": false,
"steppedLine": false,
"targets": [
{
"alias": "$col",
"groupBy": [
{
"params": [
"$__interval"
],
"type": "time"
},
{
"params": [
"null"
],
"type": "fill"
}
],
"orderByTime": "ASC",
"policy": "default",
"query": "select "in" as Interruption from linux_load_count WHERE $timeFilter fill(null)",
"rawQuery": true,
"refId": "A",
"resultFormat": "time_series",
"select": [
[
{
"params": [
"value"
],
"type": "field"
},
{
"params": [],
"type": "mean"
}
]
],
"tags": []
},
{
"alias": "$col",
"groupBy": [
{
"params": [
"$__interval"
],
"type": "time"
},
{
"params": [
"null"
],
"type": "fill"
}
],
"orderByTime": "ASC",
"policy": "default",
"query": "select "cs" as context_switch from linux_load_count WHERE $timeFilter fill(null)",
"rawQuery": true,
"refId": "B",
"resultFormat": "time_series",
"select": [
[
{
"params": [
"value"
],
"type": "field"
},
{
"params": [],
"type": "mean"
}
]
],
"tags": []
}
],
"thresholds": [],
"timeFrom": null,
"timeShift": null,
"title": "System",
"tooltip": {
"shared": true,
"sort": 0,
"value_type": "individual"
},
"type": "graph",
"xaxis": {
"buckets": null,
"mode": "time",
"name": null,
"show": true,
"values": []
},
"yaxes": [
{
"format": "short",
"label": null,
"logBase": 1,
"max": null,
"min": null,
"show": true
},
{
"format": "short",
"label": null,
"logBase": 1,
"max": null,
"min": null,
"show": true
}
],
"yaxis": {
"align": false,
"alignLevel": null
}
},
{
"aliasColors": {},
"bars": false,
"dashLength": 10,
"dashes": false,
"datasource": "${DS_VMSTAT}",
"description": "bi: 每秒读取的块数
bo: 每秒写入的块数
注意:随机磁盘读写的时候,这2个值越大(如超出1024k),能看到CPU在IO等待的值也会越大。",
"fill": 2,
"gridPos": {
"h": 9,
"w": 8,
"x": 16,
"y": 9
},
"id": 6,
"legend": {
"avg": false,
"current": false,
"max": false,
"min": false,
"show": true,
"total": false,
"values": false
},
"lines": true,
"linewidth": 2,
"links": [],
"nullPointMode": "null",
"percentage": false,
"pointradius": 5,
"points": false,
"renderer": "flot",
"seriesOverrides": [],
"spaceLength": 10,
"stack": false,
"steppedLine": false,
"targets": [
{
"alias": "$col",
"groupBy": [
{
"params": [
"$__interval"
],
"type": "time"
},
{
"params": [
"null"
],
"type": "fill"
}
],
"orderByTime": "ASC",
"policy": "default",
"query": "select bi as block_in from linux_load_count WHERE $timeFilter fill(null)",
"rawQuery": true,
"refId": "A",
"resultFormat": "time_series",
"select": [
[
{
"params": [
"value"
],
"type": "field"
},
{
"params": [],
"type": "mean"
}
]
],
"tags": []
},
{
"alias": "$col",
"groupBy": [
{
"params": [
"$__interval"
],
"type": "time"
},
{
"params": [
"null"
],
"type": "fill"
}
],
"orderByTime": "ASC",
"policy": "default",
"query": "select bo as block_out from linux_load_count WHERE $timeFilter fill(null)",
"rawQuery": true,
"refId": "B",
"resultFormat": "time_series",
"select": [
[
{
"params": [
"value"
],
"type": "field"
},
{
"params": [],
"type": "mean"
}
]
],
"tags": []
}
],
"thresholds": [],
"timeFrom": null,
"timeShift": null,
"title": "IO_Load",
"tooltip": {
"shared": true,
"sort": 0,
"value_type": "individual"
},
"type": "graph",
"xaxis": {
"buckets": null,
"mode": "time",
"name": null,
"show": true,
"values": []
},
"yaxes": [
{
"format": "kbytes",
"label": null,
"logBase": 1,
"max": null,
"min": null,
"show": true
},
{
"format": "short",
"label": null,
"logBase": 1,
"max": null,
"min": null,
"show": true
}
],
"yaxis": {
"align": false,
"alignLevel": null
}
}
],
"refresh": false,
"schemaVersion": 16,
"style": "dark",
"tags": [],
"templating": {
"list": []
},
"time": {
"from": "2018-07-25T02:07:25.151Z",
"to": "2018-07-25T02:17:25.151Z"
},
"timepicker": {
"refresh_intervals": [
"5s",
"10s",
"30s",
"1m",
"5m",
"15m",
"30m",
"1h",
"2h",
"1d"
],
"time_options": [
"5m",
"15m",
"1h",
"6h",
"12h",
"24h",
"2d",
"7d",
"30d"
]
},
"timezone": "",
"title": "linux_load",
"uid": "zeTsFdKik",
"version": 10
}