zabbix自定义监控项
监控指标
- 系统指标
- 内存
- CPU
- 硬盘
- 文件监控
- 网络监控
- 硬件监控(通过IPMI实现)
- 硬盘温度
- 电源是否异常
- CPU温度
- 业务监控
自定义监控流程
-
开启自定义监控的功能
- 修改agentd.conf文件,修改以下2行配置
- UnsafeUserParameters=1
- UserParameters=key,command 格式为:UserParameter=<键值>,<命令>
- 修改agentd.conf文件,修改以下2行配置
-
写脚本
-
web界面配置监控项,触发器
环境说明
| 环境 | IP地址 | 主机名 | 需要安装的应用 | 系统版本 |
|---|---|---|---|---|
| 服务端 | 192.168.110.30 | zabbix.example.com | lamp架构 zabbix_server zabbix_agent | redhat 8 |
| 客户端 | 192.168.110.40 | zabbix-agent | zabbix_agent | redhat 8 |
配置服务端和客户端详情参考:zabbix监控配置流程+实例演示
1. 自定义监控进程
本次监控进程以httpd服务进程为例,编译安装httpd步骤详情见:利用shell脚本实现安装httpd服务
准备工作:
//客户端
#关闭防火墙和selinux
[root@zabbix-agent ~]# systemctl stop firewalld
[root@zabbix-agent ~]# setenforce 0

#通过上面给的链接使用脚本编译安装apache
[root@zabbix-agent ~]# bash httpd.sh

#取消警告,映射软连接
[root@zabbix-agent ~]# sed -i '/#ServerName/s/#//g' /etc/httpd24/httpd.conf
[root@zabbix-agent ~]# ln -s /usr/local/apache/bin/apachectl /usr/bin/apachectl

#启动apache服务
[root@zabbix-agent ~]# apachectl start
[root@zabbix-agent ~]# ss -antl
State     Recv-Q    Send-Q         Local Address:Port          Peer Address:Port
LISTEN    0         128                  0.0.0.0:80                 0.0.0.0:*
LISTEN    0         128                  0.0.0.0:22                 0.0.0.0:*
LISTEN    0         128                  0.0.0.0:10050              0.0.0.0:*
LISTEN    0         128                     [::]:22                    [::]:*
第一步:编写脚本
//服务端
#创建脚本目录
[root@zabbix-agent ~]# mkdir /scripts

#脚本内容
[root@zabbix-agent ~]# vim /scripts/check_process.sh

#以查看进程的方式,过滤apache进程,输出1表示进程有问题,0表示没问题
#!/bin/bash

count=$(ps -ef | grep -Ev "grep|$0" | grep -c "$1")
if [ $count -eq 0 ];then
        echo "1"
else
        echo "0"
fi

#给脚本执行权限
[root@zabbix-agent ~]# chmod +x /scripts/check_process.sh
[root@zabbix-agent ~]# ll /scripts/
total 4
-rwxr-xr-x. 1 root root 118 Apr 29 00:02 check_process.sh

#测试
[root@zabbix-agent ~]# apachectl start
[root@zabbix-agent ~]# bash /scripts/check_process.sh httpd
0
[root@zabbix-agent ~]# apachectl stop
[root@zabbix-agent ~]# bash /scripts/check_process.sh httpd
1
第二步:开启自定义监控功能
//客户端
#开启自定义监控并添加指标
[root@zabbix-agent ~]# vim /usr/local/etc/zabbix_agentd.conf

# Mandatory: no
# Default:
# TLSCipherAll=

#在最后面添加以下内容
UnsafeUserParameters=1
UserParameter=check_apache,/scripts/check_process.sh httpd

#重启zabbix
[root@zabbix-agent ~]# pkill zabbix
[root@zabbix-agent ~]# zabbix_agentd
[root@zabbix-agent ~]# ss -antl
State     Recv-Q    Send-Q         Local Address:Port          Peer Address:Port
LISTEN    0         128                  0.0.0.0:22                 0.0.0.0:*
LISTEN    0         128                  0.0.0.0:10050              0.0.0.0:*
LISTEN    0         128                     [::]:22                    [::]:*

#使用服务端测试是否能获取客户端的指标
[root@zabbix ~]# zabbix_get -s 192.168.110.40 -k check_apache
1
第三步:web界面配置
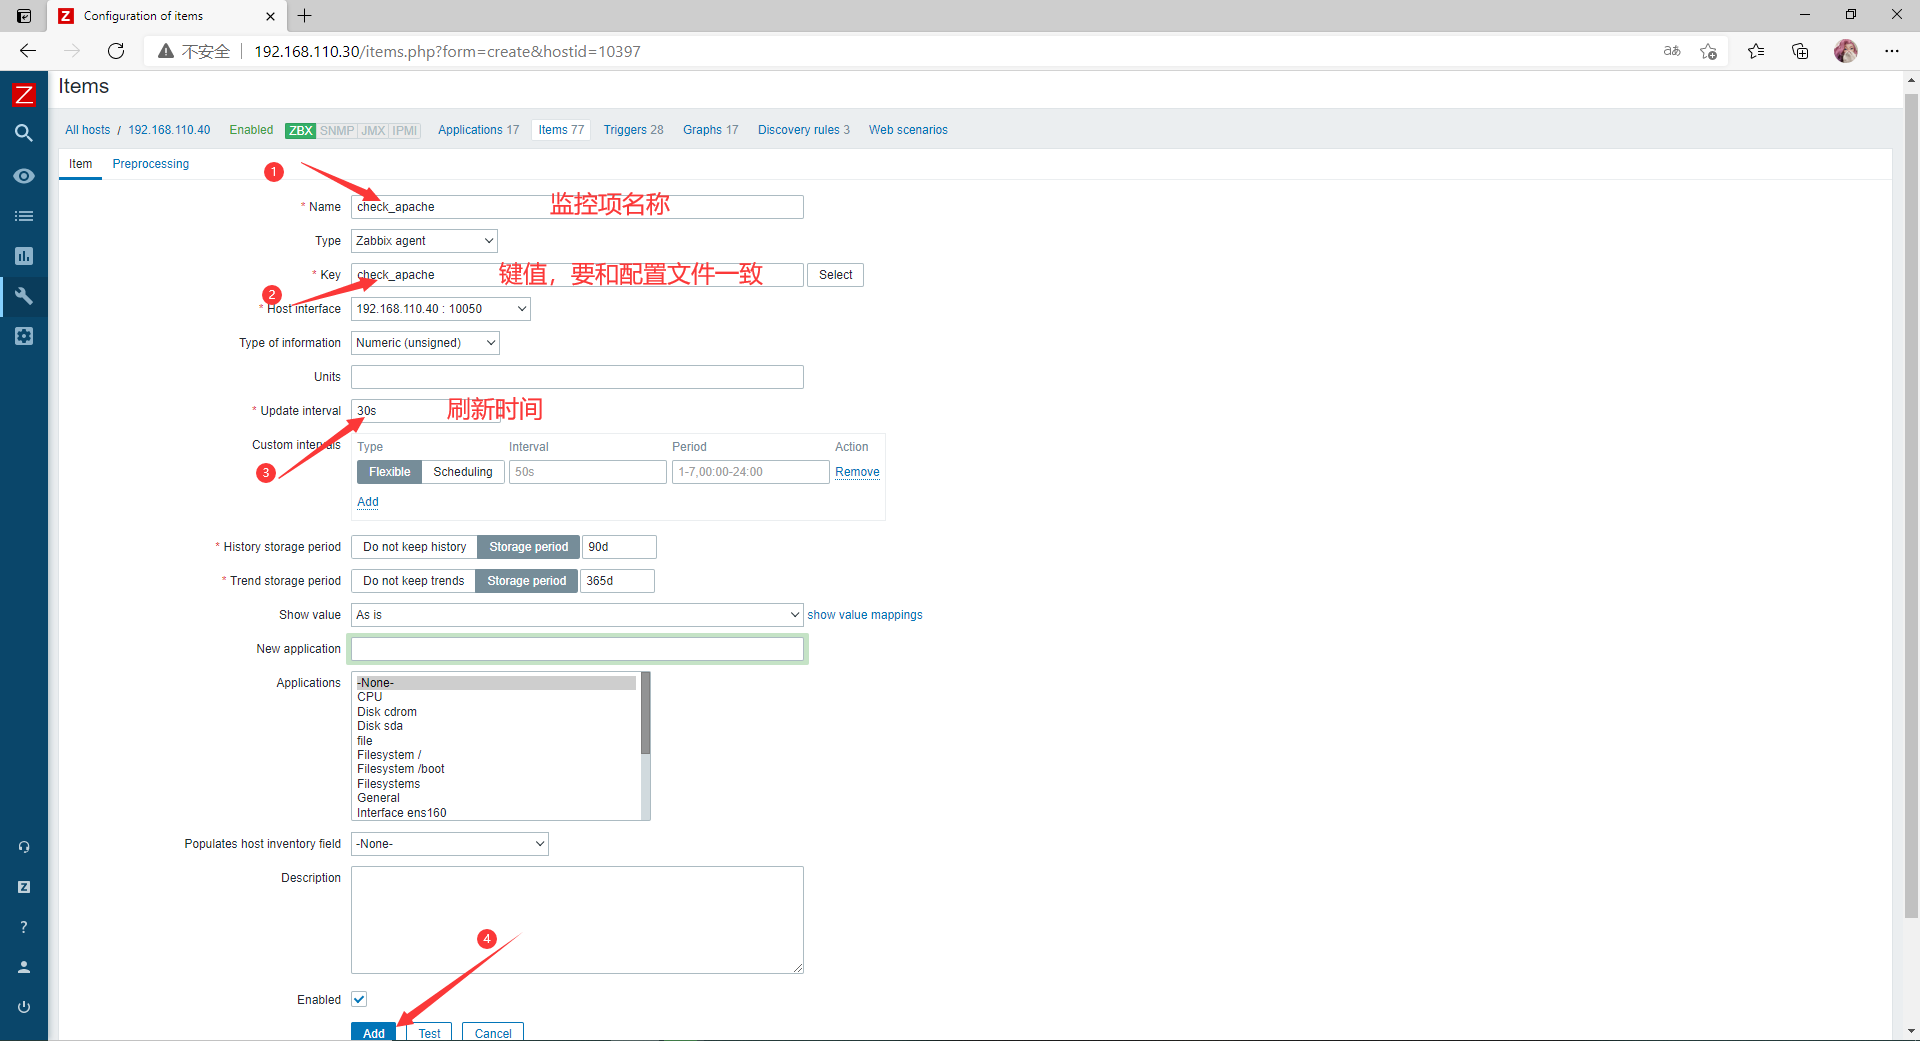
- 添加监控项
点击Configuration ---> Hosts ---> 客户机(192.168.110.40)的Items ---> 右上角Create Items
- 添加触发器
点击 Configuration ---> Hosts ---> 客户机(192.168.110.40)的Triggers ---> 右上角Create triggers

- 配置媒介和动作
配置媒介和动作方法详情请见:zabbix监控服务-邮箱告警的三种配置方式
- 触发触发器
//客户端
#停止apache服务,触发告警
[root@zabbix-agent ~]# apachectl stop
[root@zabbix-agent ~]# ss -antl
State     Recv-Q    Send-Q         Local Address:Port          Peer Address:Port
LISTEN    0         128                  0.0.0.0:22                 0.0.0.0:*
LISTEN    0         128                  0.0.0.0:10050              0.0.0.0:*
LISTEN    0         128                     [::]:22                    [::]:*
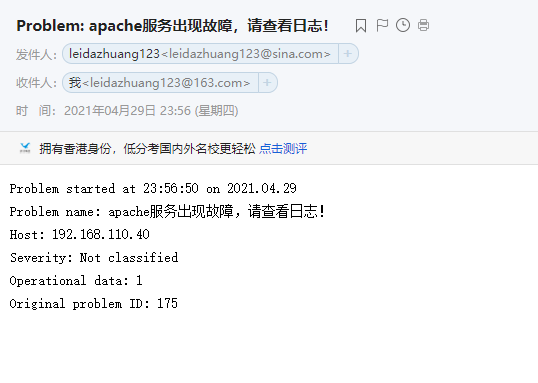
- 邮箱验证

2. 自定义监控日志
下载log.py文件到本机
log.py文件详情见:leidazhuang_Github
编写脚本
log.py作用:检查日志文件中是否有指定的关键字
- 第一个参数为日志文件名(必须有,相对路径、绝对路径均可)
- 第二个参数为seek position文件的路径(可选项,若不设置则默认为/tmp/logseek文件。相对路径、绝对路径均可)
- 第三个参数为搜索关键字,默认为 Error
//客户端
#安装python36
[root@zabbix-agent ~]# yum -y install python36

#本脚本用于检查日志文件中是否有指定关键字
[root@zabbix-agent scripts]# cat log.py
#!/usr/bin/env python3
import sys
import re

def prePos(seekfile):
    global curpos
    try:
        cf = open(seekfile)
    except IOError:
        curpos = 0
        return curpos
    except FileNotFoundError:
        curpos = 0
        return curpos
    else:
        try:
            curpos = int(cf.readline().strip())
        except ValueError:
            curpos = 0
            cf.close()
            return curpos
        cf.close()
    return curpos

def lastPos(filename):
    with open(filename) as lfile:
        if lfile.readline():
            lfile.seek(0,2)
        else:
            return 0
        lastPos = lfile.tell()
    return lastPos

def getSeekFile():
    try:
        seekfile = sys.argv[2]
    except IndexError:
        seekfile = '/tmp/logseek'
    return seekfile

def getKey():
    try:
        tagKey = str(sys.argv[3])
    except IndexError:
        tagKey = 'Error'
    return tagKey

def getResult(filename,seekfile,tagkey):
    destPos = prePos(seekfile)
    curPos = lastPos(filename)

    if curPos < destPos:
        curpos = 0

    try:
        f = open(filename)
    except IOError:
        print('Could not open file: %s' % filename)
    except FileNotFoundError:
        print('Could not open file: %s' % filename)
    else:
        f.seek(destPos)

        while curPos != 0 and f.tell() < curPos:
            rresult = f.readline().strip()
            global result
            if re.search(tagkey, rresult):
                result = 1
                break
            else:
                result = 0

        with open(seekfile,'w') as sf:
            sf.write(str(curPos))
    finally:
        f.close()
    return result

if __name__ == "__main__":
    result = 0
    curpos = 0
    tagkey = getKey()
    seekfile = getSeekFile()
    result = getResult(sys.argv[1],seekfile,tagkey)
    print(result)
添加指标
//客户端
#开启自定义监控功能,添加指标
[root@zabbix-agent ~]# vim /usr/local/etc/zabbix_agentd.conf
# Mandatory: no
# Default:
# TLSCipherAll=

UnsafeUserParameters=1
UserParameter=check_apache,/scripts/check_process.sh httpd
#在最后面添加以下内容
UserParameter=check_logs[*],/scripts/log.py $1 $2 $3

#重启zabbix
[root@zabbix-agent ~]# pkill zabbix
[root@zabbix-agent ~]# zabbix_agentd
[root@zabbix-agent ~]# ss -antl
State     Recv-Q    Send-Q         Local Address:Port          Peer Address:Port
LISTEN    0         80                   0.0.0.0:3306               0.0.0.0:*
LISTEN    0         128                  0.0.0.0:80                 0.0.0.0:*
LISTEN    0         128                  0.0.0.0:22                 0.0.0.0:*
LISTEN    0         128                  0.0.0.0:10050              0.0.0.0:*
LISTEN    0         128                     [::]:22                    [::]:*

#手动触发警告
[root@zabbix-agent ~]# echo 'Error' >> /usr/local/apache/logs/error_log

//服务端
#使用服务端测试是否能获取客户端的指标
#监控/usr/local/apache/logs/error_logs文件,seek position文件为默认的/tmp/seek,关键字为Error

#第一次结果为0说明搜索到Error
[root@zabbix ~]# zabbix_get -s 192.168.110.40 -k  check_logs["/usr/local/apache/logs/error_log","/tmp/seek","Error"]
1

#第二次结果为1是因为在第一次的报错之后,并没有找到Error
[root@zabbix ~]# zabbix_get -s 192.168.110.40 -k  check_logs["/usr/local/apache/logs/error_log","/tmp/seek","Error"]
0
web界面配置
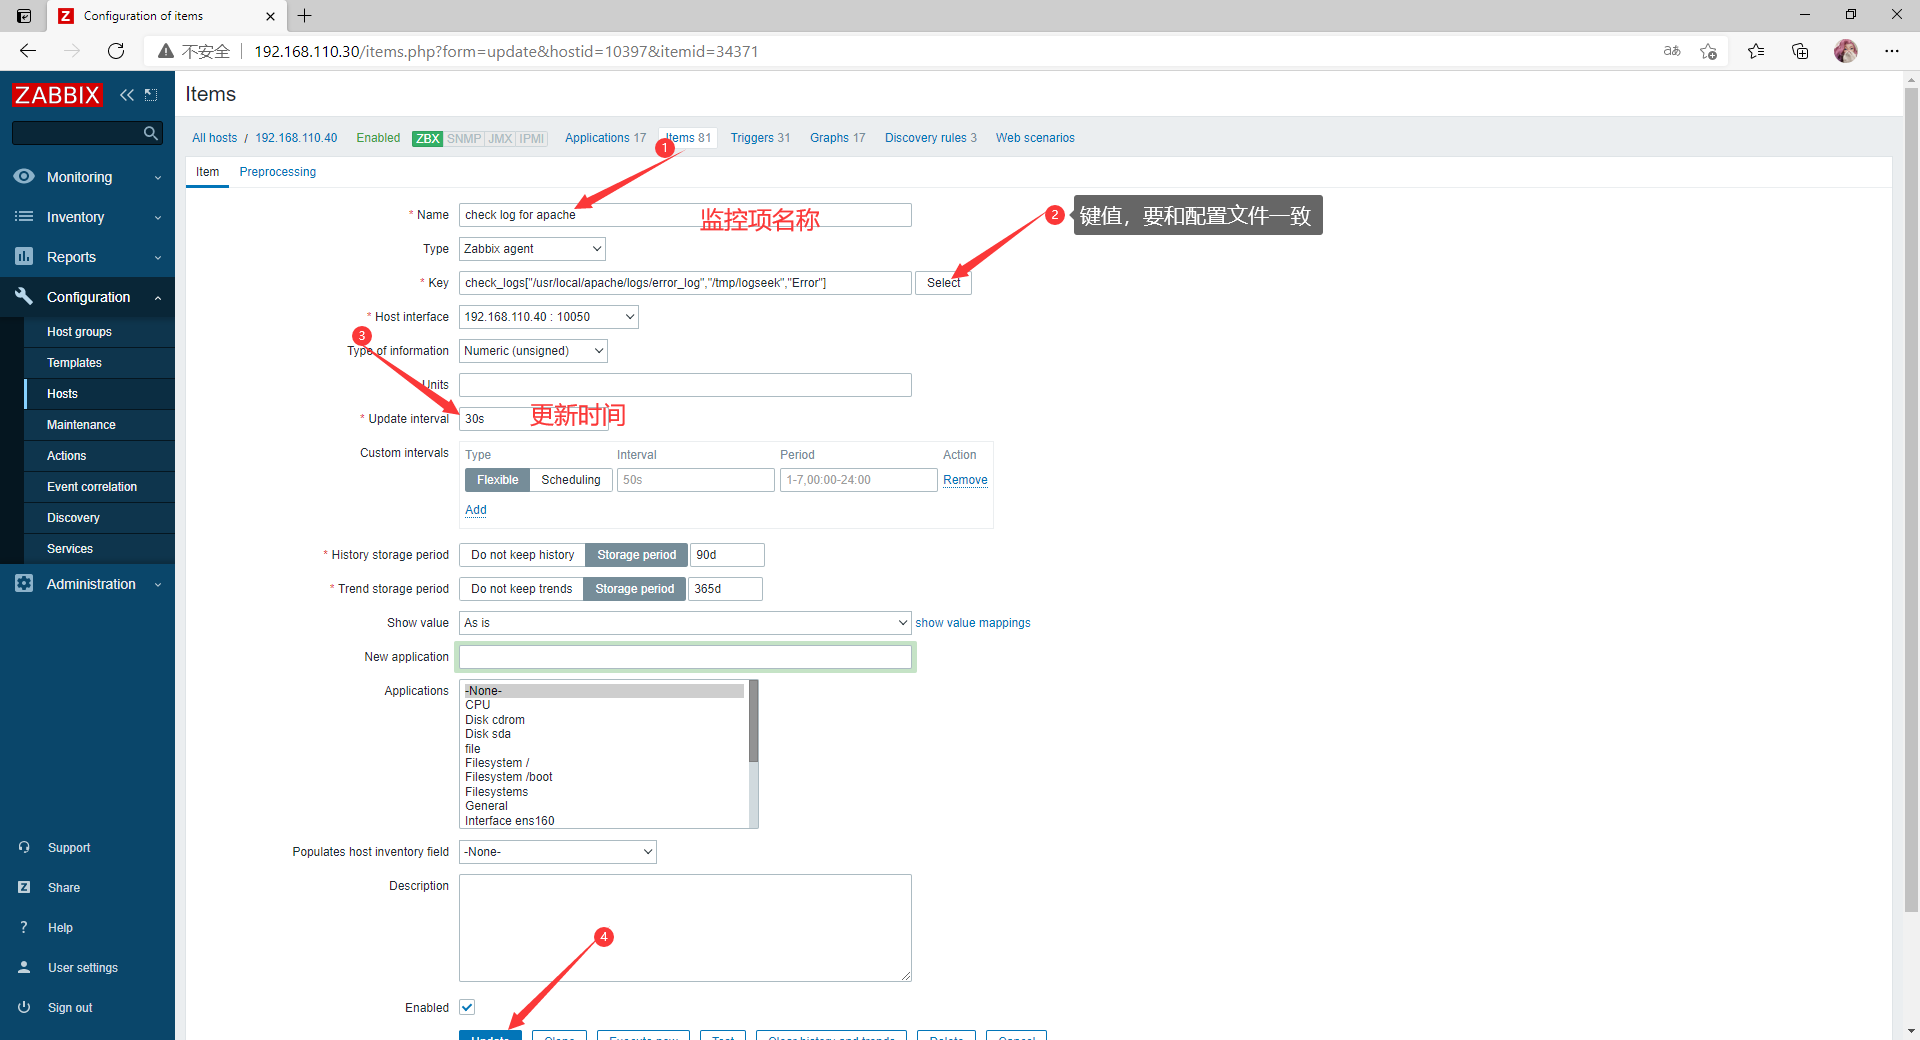
- 添加监控项
点击Configuration ---> Hosts ---> 客户机(192.168.110.40)的Items ---> 右上角Create Items
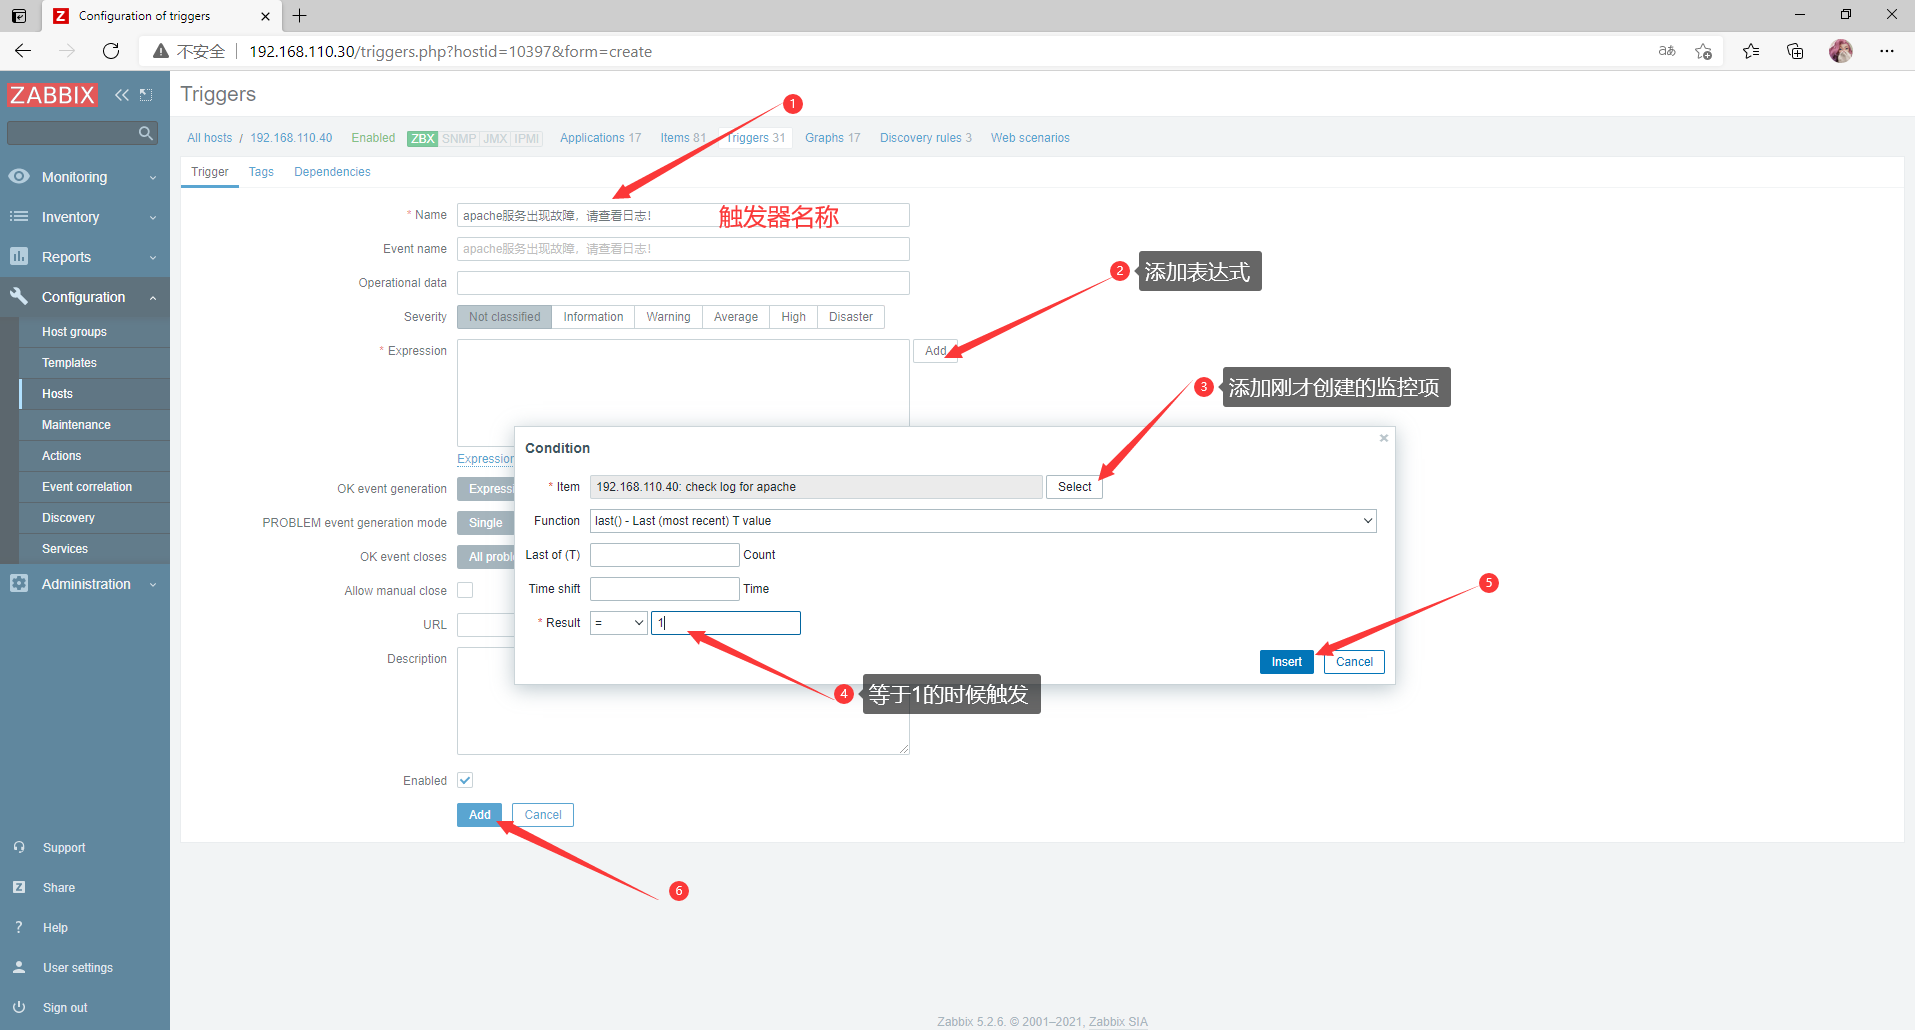
- 添加触发器
点击 Configuration ---> Hosts ---> 客户机(192.168.110.40)的Triggers ---> 右上角Create triggers
- 配置媒介和动作
配置媒介和动作方法详情请见:zabbix监控服务-邮箱告警的三种配置方式
- 触发触发器
//客户端
#手动输入Error触发警告
[root@zabbix-agent ~]# echo 'Error' >> /usr/local/apache/logs/error_log

//服务端
#取值为1
[root@zabbix ~]# zabbix_get -s 192.168.110.40 -k  check_logs["/usr/local/apache/logs/error_log","/tmp/logseek","Error"]
1
- 邮箱测试
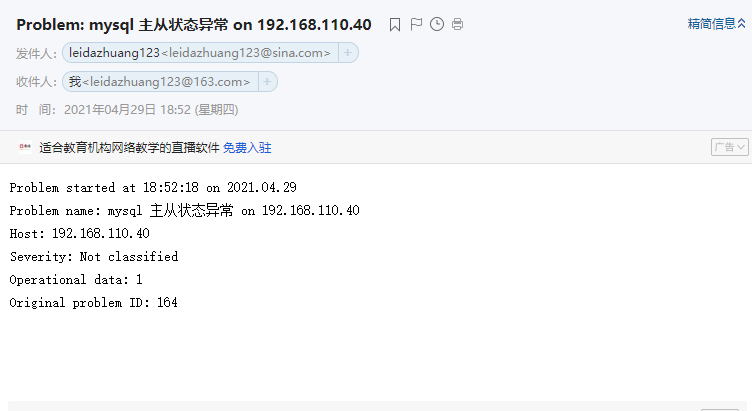
3. 自定义监控mysql主从状态
环境说明
增加一台机器 192.168.110.50,当作主msater数据库
| 环境 | IP地址 | 需要安装的应用 | 系统版本 |
|---|---|---|---|
| 主:master | 192.168.110.50 | mariadb | redhat 8 |
| 从:slave | 192.168.110.40 | mariadb | redhat 8 |
准备工作
//master端
#安装数据库
[root@master ~]# yum -y install mariadb*

#启动服务
[root@master ~]# systemctl enable --now mariadb

#关闭防火墙和selinux
[root@master ~]# systemctl disenable --now firewalld
Unknown operation disenable.
[root@master ~]# systemctl disable --now firewalld
Removed /etc/systemd/system/multi-user.target.wants/firewalld.service.
Removed /etc/systemd/system/dbus-org.fedoraproject.FirewallD1.service.
[root@master ~]# sed -i "s/SELINUX=enforcing/SELINUX=disabled/g" /etc/selinux/config
[root@master ~]# setenforce 0

//slave端
#安装数据库
[root@slave ~]# yum -y install mariadb*

#启动服务
[root@slave ~]# systemctl enable --now mariadb

#关闭防火墙和selinux
[root@slave ~]# systemctl disenable --now firewalld
Unknown operation disenable.
[root@slave ~]# systemctl disable --now firewalld
Removed /etc/systemd/system/multi-user.target.wants/firewalld.service.
Removed /etc/systemd/system/dbus-org.fedoraproject.FirewallD1.service.
[root@slave ~]# sed -i "s/SELINUX=enforcing/SELINUX=disabled/g" /etc/selinux/config
[root@slave ~]# setenforce 0
配置master主数据库
//master端
#测试数据库
[root@master ~]# mysql -uroot
Welcome to the MariaDB monitor.  Commands end with ; or g.
Your MariaDB connection id is 22
Server version: 10.3.28-MariaDB-log MariaDB Server

Copyright (c) 2000, 2018, Oracle, MariaDB Corporation Ab and others.

Type 'help;' or 'h' for help. Type 'c' to clear the current input statement.
#授权
MariaDB [(none)]> grant replication slave on *.* to 'repl'@'192.168.110.40' identified by 'repl123!';
Query OK, 0 rows affected (0.001 sec)
#刷新
MariaDB [(none)]> flush privileges;
Query OK, 0 rows affected (0.001 sec)

MariaDB [(none)]> exit
Bye

#配置my.cnf文件
[root@master ~]# vim /etc/my.cnf
#
# include all files from the config directory
#
!includedir /etc/my.cnf.d
#最后面加下以下信息
[mysqld]
log-bin=mysql-bin
server-id=1

#重启mysql,查看状态
[root@master ~]# systemctl restart mariadb
[root@master ~]# mysql -uroot
Welcome to the MariaDB monitor.  Commands end with ; or g.
Your MariaDB connection id is 9
Server version: 10.3.28-MariaDB-log MariaDB Server

Copyright (c) 2000, 2018, Oracle, MariaDB Corporation Ab and others.

Type 'help;' or 'h' for help. Type 'c' to clear the current input statement.

MariaDB [(none)]> show master status;
+------------------+----------+--------------+------------------+
| File             | Position | Binlog_Do_DB | Binlog_Ignore_DB |
+------------------+----------+--------------+------------------+
| mysql-bin.000001 |      328 |              |                  |
+------------------+----------+--------------+------------------+
1 row in set (0.000 sec)

MariaDB [(none)]> exit
Bye
配置slave从数据库
//slave端
#测试数据库
[root@slave ~]# mysql -uroot
Welcome to the MariaDB monitor.  Commands end with ; or g.
Your MariaDB connection id is 8
Server version: 10.3.28-MariaDB MariaDB Server

Copyright (c) 2000, 2018, Oracle, MariaDB Corporation Ab and others.

Type 'help;' or 'h' for help. Type 'c' to clear the current input statement.

MariaDB [(none)]> exit
Bye

#配置my.cnf文件
[root@slave ~]# vim /etc/my.cnf
#
# include all files from the config directory
#
!includedir /etc/my.cnf.d
#最后添加以下信息
[mysqld]
server-id=20
relay-log=myrelay

#重启mysql,配置并启动主从复制
[root@slave ~]# mysql -uroot
Welcome to the MariaDB monitor.  Commands end with ; or g.
Your MariaDB connection id is 9
Server version: 10.3.28-MariaDB MariaDB Server

Copyright (c) 2000, 2018, Oracle, MariaDB Corporation Ab and others.

Type 'help;' or 'h' for help. Type 'c' to clear the current input statement.

MariaDB [(none)]> change master to
    -> master_host='192.168.110.50',
    -> master_user='repl',
    -> master_password='repl123!',
    -> master_log_file='mysql-bin.000001',
    -> master_log_pos=328;

Query OK, 0 rows affected (0.003 sec)

MariaDB [(none)]> start slave;

Query OK, 0 rows affected (0.002 sec)

MariaDB [(none)]> show slave status G
*************************** 1. row ***************************
                Slave_IO_State: Waiting for master to send event
                   Master_Host: 192.168.110.50
                   Master_User: repl
                   Master_Port: 3306
                 Connect_Retry: 60
               Master_Log_File: mysql-bin.000001
           Read_Master_Log_Pos: 652
                Relay_Log_File: myrelay.000003
                 Relay_Log_Pos: 555
         Relay_Master_Log_File: mysql-bin.000001
              Slave_IO_Running: Yes
             Slave_SQL_Running: Yes
               Replicate_Do_DB:
           Replicate_Ignore_DB:
    Slave_Transactional_Groups: 0
1 row in set (0.000 sec)

MariaDB [(none)]> exit
Bye
编写脚本
//slave端
#脚本内容
[root@slave ~]# vim /scripts/check_mysql_repl.sh

#!/bin/bash

count=$(mysql -uroot -e 'show slave statusG'|grep 'Running:'|awk '{print $2}'|grep -c 'Yes')

if [ $count -ne 2 ];then
        echo '1'
else
        echo '0'
fi

#给脚本执行权限
[root@slave ~]# chmod +x /scripts/check_mysql_repl.sh
[root@slave ~]# ll /scripts/
total 12
-rwxr-xr-x. 1 root root  179 Apr 29 15:33 check_mysql_repl.sh
-rwxr-xr-x. 1 root root  118 Apr 29 00:02 check_process.sh

#测试脚本
[root@slave ~]# bash /scripts/check_mysql_repl.sh
0
添加指标
//slave端
#开启自定义监控功能,添加指标
[root@slave ~]# vim /usr/local/etc/zabbix_agentd.conf
# Mandatory: no
# Default:
# TLSCipherAll=

UnsafeUserParameters=1
UserParameter=check_apache,/scripts/check_process.sh httpd
UserParameter=check_logs[*],/scripts/log.py $1 $2 $3
#在最后面添加以下内容
UserParameter=check_mysql_repl,/scripts/check_mysql_repl.sh

#重启zabbix
[root@slave ~]# pkill zabbix
[root@slave ~]# zabbix_agentd
[root@slave ~]# ss -antl
State     Recv-Q    Send-Q         Local Address:Port          Peer Address:Port
LISTEN    0         80                   0.0.0.0:3306               0.0.0.0:*
LISTEN    0         128                  0.0.0.0:80                 0.0.0.0:*
LISTEN    0         128                  0.0.0.0:22                 0.0.0.0:*
LISTEN    0         128                  0.0.0.0:10050              0.0.0.0:*
LISTEN    0         128                     [::]:22                    [::]:*

#使用服务端测试是否能获取客户端的指标
[root@zabbix ~]# zabbix_get -s 192.168.110.40 -k check_mysql_repl
0
web界面配置
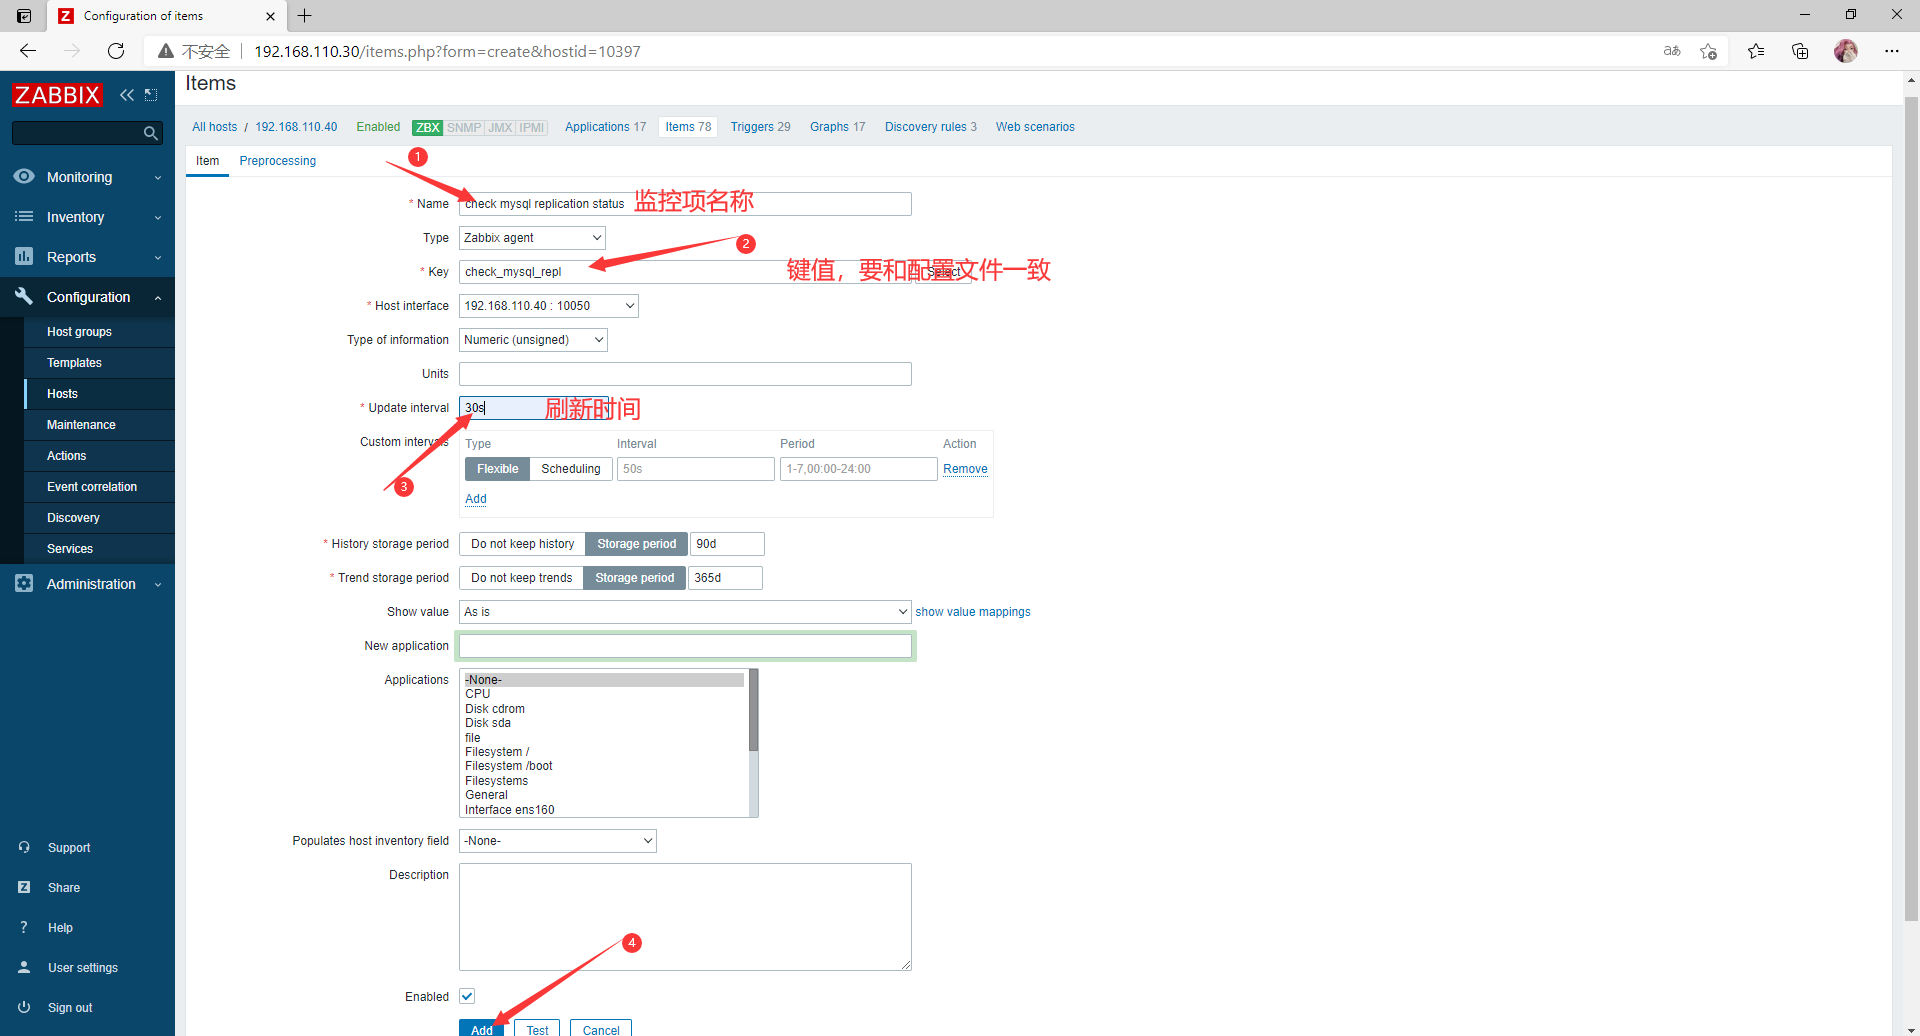
- 添加监控项
点击Configuration ---> Hosts ---> 客户机(192.168.110.40)的Items ---> 右上角Create Items
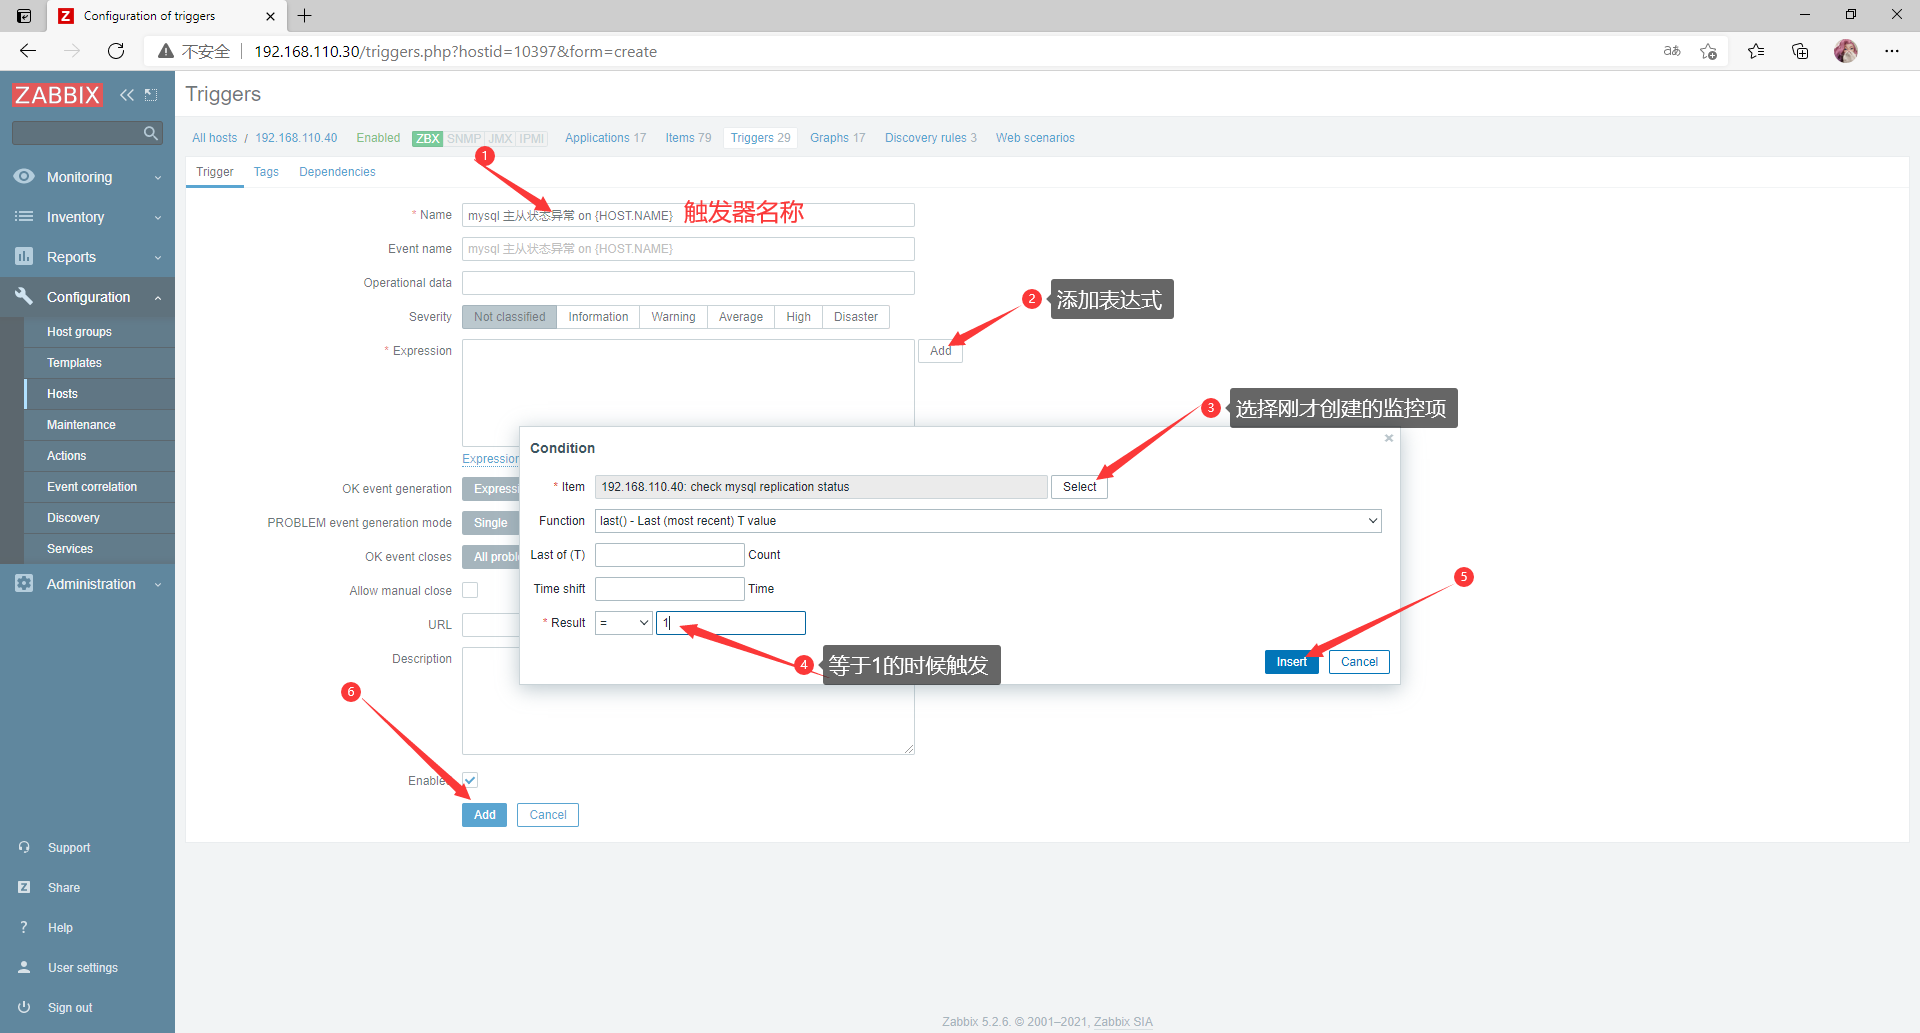
- 添加触发器
点击 Configuration ---> Hosts ---> 客户机(192.168.110.40)的Triggers ---> 右上角Create triggers
- 配置媒介和动作
配置媒介和动作方法详情请见:zabbix监控服务-邮箱告警的三种配置方式
- 触发触发器
//slave端
#关闭slave,触发告警
[root@slave ~]# mysql -uroot
Welcome to the MariaDB monitor.  Commands end with ; or g.
Your MariaDB connection id is 70
Server version: 10.3.28-MariaDB MariaDB Server

Copyright (c) 2000, 2018, Oracle, MariaDB Corporation Ab and others.

Type 'help;' or 'h' for help. Type 'c' to clear the current input statement.

MariaDB [(none)]> stop slave;
Query OK, 0 rows affected, 1 warning (0.015 sec)

MariaDB [(none)]> show slave status G
*************************** 1. row ***************************
                Slave_IO_State:
                   Master_Host: 192.168.110.50
                   Master_User: repl
                   Master_Port: 3306
                 Connect_Retry: 60
               Master_Log_File: mysql-bin.000001
           Read_Master_Log_Pos: 652
                Relay_Log_File: myrelay.000006
                 Relay_Log_Pos: 555
         Relay_Master_Log_File: mysql-bin.000001
              Slave_IO_Running: No
             Slave_SQL_Running: No
               Replicate_Do_DB:
           Replicate_Ignore_DB:
1 row in set (0.000 sec)

MariaDB [(none)]> exit
Bye
- 邮箱验证
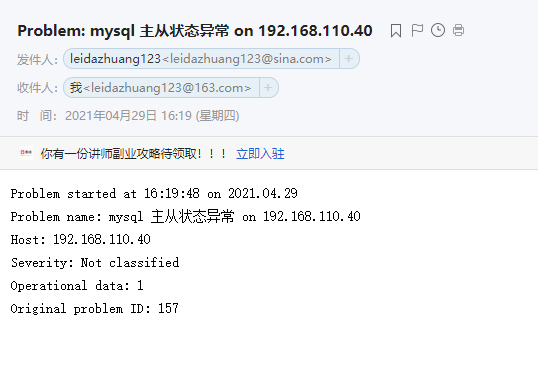
4. 自定义监控mysql主从延迟
编写脚本
//slave端
#脚本内容
[root@slave ~]# vim /scripts/check_mysql_delay.sh

#!/bin/bash

mysql -uroot -e 'show slave status G'|grep 'Seconds_Behind_Master:'|awk '{print $2}'

#给脚本执行权限
[root@slave ~]# chmod +x /scripts/check_mysql_delay.sh
[root@slave ~]# ll /scripts/
total 16
-rwxr-xr-x. 1 root root  100 Apr 29 17:11 check_mysql_delay.sh
-rwxr-xr-x. 1 root root  179 Apr 29 15:33 check_mysql_repl.sh
-rwxr-xr-x. 1 root root  118 Apr 29 00:02 check_process.sh

#测试脚本
[root@slave ~]# mysql -uroot -e 'show slave status G'
*************************** 1. row ***************************
                Slave_IO_State: Waiting for master to send event
                   Master_Host: 192.168.110.50
                   Master_User: repl
                   Master_Port: 3306
                 Connect_Retry: 60
               Master_Log_File: mysql-bin.000001
           Read_Master_Log_Pos: 652
                Relay_Log_File: myrelay.000007
                 Relay_Log_Pos: 555
         Relay_Master_Log_File: mysql-bin.000001
              Slave_IO_Running: Yes
             Slave_SQL_Running: Yes
               Replicate_Do_DB:
           Replicate_Ignore_DB:
#slave落后master的秒数
         Seconds_Behind_Master: 0
[root@slave ~]# bash /scripts/check_mysql_delay.sh
0
添加指标
//slave端
#开启自定义监控功能,添加指标
[root@slave ~]# vim /usr/local/etc/zabbix_agentd.conf
# Mandatory: no
# Default:
# TLSCipherAll=

UnsafeUserParameters=1
UserParameter=check_apache,/scripts/check_process.sh httpd
UserParameter=check_logs[*],/scripts/log.py $1 $2 $3
UserParameter=check_mysql_repl,/scripts/check_mysql_repl.sh
#在最后面添加以下内容
UserParameter=check_mysql_delay,/scripts/check_mysql_delay.sh

//重启zabbix
[root@slave ~]# pkill zabbix
[root@slave ~]# zabbix_agentd

//使用服务端测试是否能获取客户端的指标
[root@zabbix ~]# zabbix_get -s 192.168.110.40 -k check_mysql_delay
0
web界面配置
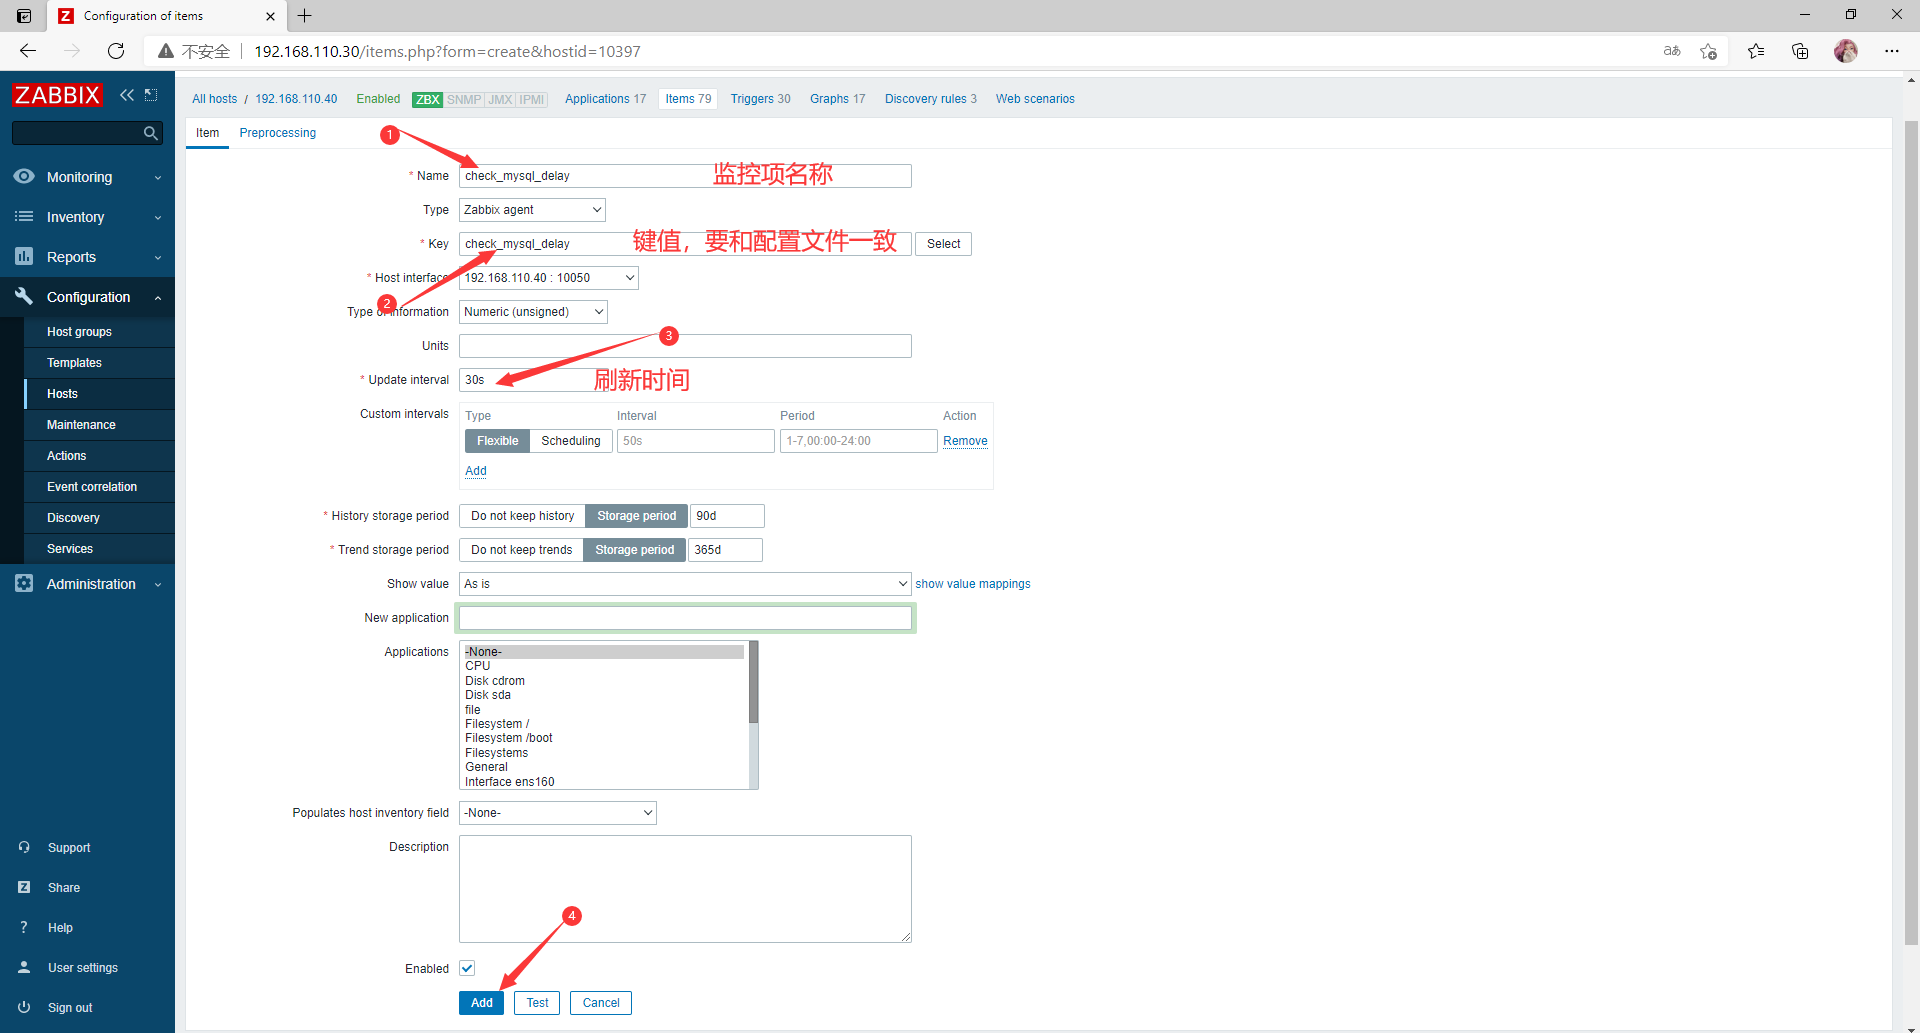
- 添加监控项
点击Configuration ---> Hosts ---> 客户机(192.168.110.40)的Items ---> 右上角Create Items
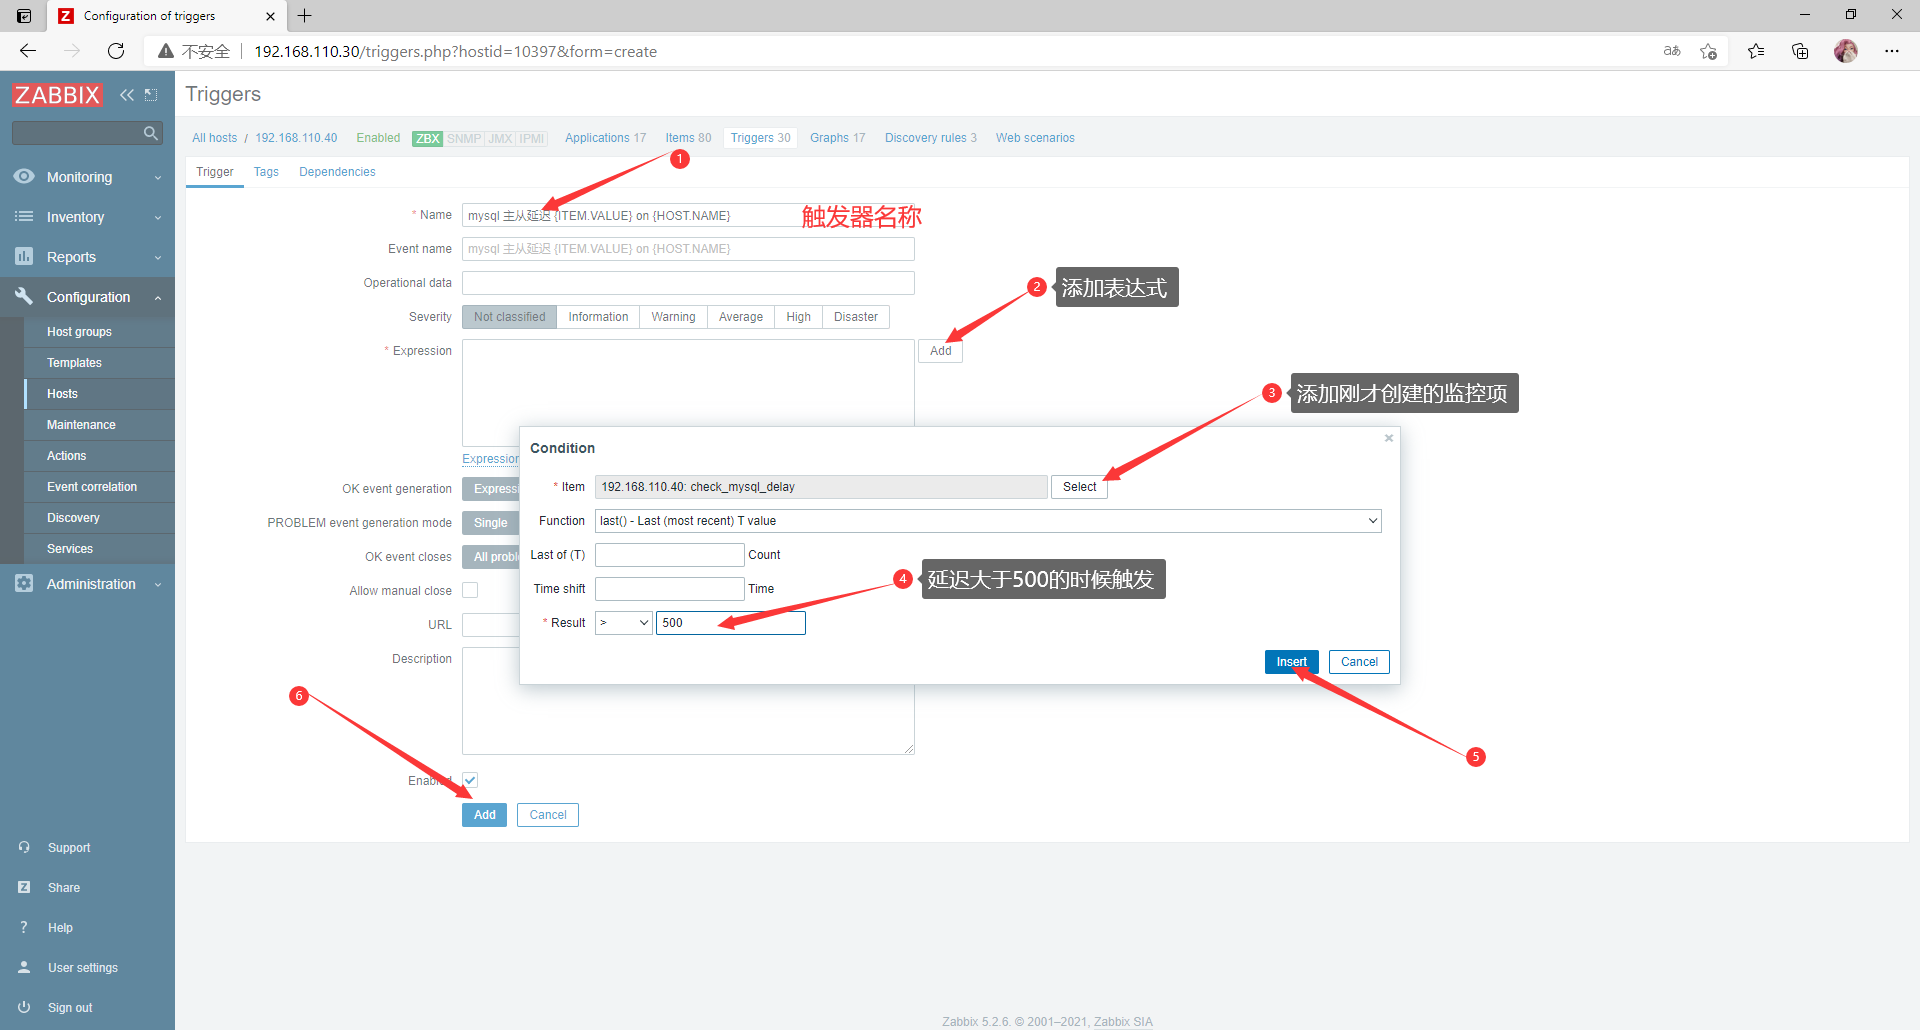
- 添加触发器
点击 Configuration ---> Hosts ---> 客户机(192.168.110.40)的Triggers ---> 右上角Create triggers
- 配置媒介和动作
配置媒介和动作方法详情请见:zabbix监控服务-邮箱告警的三种配置方式
- 触发触发器
//slave端
#开启slave,延迟为0,触发告警
[root@slave ~]# mysql -uroot
Welcome to the MariaDB monitor.  Commands end with ; or g.
Your MariaDB connection id is 407
Server version: 10.3.28-MariaDB MariaDB Server

Copyright (c) 2000, 2018, Oracle, MariaDB Corporation Ab and others.

Type 'help;' or 'h' for help. Type 'c' to clear the current input statement.

MariaDB [(none)]> start slave;
Query OK, 0 rows affected (0.001 sec)

MariaDB [(none)]> show slave status G
*************************** 1. row ***************************
                Slave_IO_State: Waiting for master to send event
                   Master_Host: 192.168.110.50
                   Master_User: repl
                   Master_Port: 3306
                 Connect_Retry: 60
               Master_Log_File: mysql-bin.000001
           Read_Master_Log_Pos: 652
                Relay_Log_File: myrelay.000008
                 Relay_Log_Pos: 555
         Relay_Master_Log_File: mysql-bin.000001
              Slave_IO_Running: Yes
             Slave_SQL_Running: Yes
               Replicate_Do_DB:
           Replicate_Ignore_DB:
#延迟为0
         Seconds_Behind_Master: 0
1 row in set (0.000 sec)

MariaDB [(none)]> exit
Bye
这里临时修改为延迟为0的时候触发告警

- 邮箱验证