注:使用kube-prometheus安装非常方便,前面的prometheus+grafana+metrics-server都不用安装,已经集成在里面。
1、clone github地址
git clone https://github.com/coreos/kube-prometheus.git
cd kube-prometheus
2、查看manifest路径下所有的yaml文件
[root@master1 manifests]# ll
total 1724
-rw-r--r-- 1 root root     782 Jan 13 07:49 alertmanager-alertmanager.yaml
-rw-r--r-- 1 root root    1169 Jan 13 07:49 alertmanager-secret.yaml
-rw-r--r-- 1 root root     301 Jan 13 07:49 alertmanager-serviceAccount.yaml
-rw-r--r-- 1 root root     540 Jan 13 07:49 alertmanager-serviceMonitor.yaml
-rw-r--r-- 1 root root     632 Jan 13 08:33 alertmanager-service.yaml
-rw-r--r-- 1 root root     278 Jan 13 07:49 blackbox-exporter-clusterRoleBinding.yaml
-rw-r--r-- 1 root root     287 Jan 13 07:49 blackbox-exporter-clusterRole.yaml
-rw-r--r-- 1 root root    1392 Jan 13 07:49 blackbox-exporter-configuration.yaml
-rw-r--r-- 1 root root    2994 Jan 13 07:49 blackbox-exporter-deployment.yaml
-rw-r--r-- 1 root root      96 Jan 13 07:49 blackbox-exporter-serviceAccount.yaml
-rw-r--r-- 1 root root     680 Jan 13 07:49 blackbox-exporter-serviceMonitor.yaml
-rw-r--r-- 1 root root     540 Jan 13 07:49 blackbox-exporter-service.yaml
-rw-r--r-- 1 root root     550 Jan 13 07:49 grafana-dashboardDatasources.yaml
-rw-r--r-- 1 root root 1403543 Jan 13 07:49 grafana-dashboardDefinitions.yaml
-rw-r--r-- 1 root root     454 Jan 13 07:49 grafana-dashboardSources.yaml
-rw-r--r-- 1 root root    7722 Jan 13 07:49 grafana-deployment.yaml
-rw-r--r-- 1 root root      86 Jan 13 07:49 grafana-serviceAccount.yaml
-rw-r--r-- 1 root root     379 Jan 13 07:49 grafana-serviceMonitor.yaml
-rw-r--r-- 1 root root     273 Jan 13 08:34 grafana-service.yaml
-rw-r--r-- 1 root root     464 Jan 13 07:49 kube-state-metrics-clusterRoleBinding.yaml
-rw-r--r-- 1 root root    1739 Jan 13 07:49 kube-state-metrics-clusterRole.yaml
-rw-r--r-- 1 root root    2803 Jan 13 07:49 kube-state-metrics-deployment.yaml
-rw-r--r-- 1 root root     280 Jan 13 07:49 kube-state-metrics-serviceAccount.yaml
-rw-r--r-- 1 root root    1011 Jan 13 07:49 kube-state-metrics-serviceMonitor.yaml
-rw-r--r-- 1 root root     580 Jan 13 07:49 kube-state-metrics-service.yaml
-rw-r--r-- 1 root root     444 Jan 13 07:49 node-exporter-clusterRoleBinding.yaml
-rw-r--r-- 1 root root     461 Jan 13 07:49 node-exporter-clusterRole.yaml
-rw-r--r-- 1 root root    2907 Jan 13 07:49 node-exporter-daemonset.yaml
-rw-r--r-- 1 root root     270 Jan 13 07:49 node-exporter-serviceAccount.yaml
-rw-r--r-- 1 root root     850 Jan 13 07:49 node-exporter-serviceMonitor.yaml
-rw-r--r-- 1 root root     492 Jan 13 07:49 node-exporter-service.yaml
-rw-r--r-- 1 root root     482 Jan 13 07:49 prometheus-adapter-apiService.yaml
-rw-r--r-- 1 root root     576 Jan 13 07:49 prometheus-adapter-clusterRoleAggregatedMetricsReader.yaml
-rw-r--r-- 1 root root     494 Jan 13 07:49 prometheus-adapter-clusterRoleBindingDelegator.yaml
-rw-r--r-- 1 root root     471 Jan 13 07:49 prometheus-adapter-clusterRoleBinding.yaml
-rw-r--r-- 1 root root     378 Jan 13 07:49 prometheus-adapter-clusterRoleServerResources.yaml
-rw-r--r-- 1 root root     409 Jan 13 07:49 prometheus-adapter-clusterRole.yaml
-rw-r--r-- 1 root root    1568 Jan 13 07:49 prometheus-adapter-configMap.yaml
-rw-r--r-- 1 root root    1804 Jan 13 07:49 prometheus-adapter-deployment.yaml
-rw-r--r-- 1 root root     515 Jan 13 07:49 prometheus-adapter-roleBindingAuthReader.yaml
-rw-r--r-- 1 root root     287 Jan 13 07:49 prometheus-adapter-serviceAccount.yaml
-rw-r--r-- 1 root root     677 Jan 13 07:49 prometheus-adapter-serviceMonitor.yaml
-rw-r--r-- 1 root root     501 Jan 13 07:49 prometheus-adapter-service.yaml
-rw-r--r-- 1 root root     447 Jan 13 07:49 prometheus-clusterRoleBinding.yaml
-rw-r--r-- 1 root root     394 Jan 13 07:49 prometheus-clusterRole.yaml
-rw-r--r-- 1 root root     621 Jan 13 07:49 prometheus-operator-serviceMonitor.yaml
-rw-r--r-- 1 root root    1153 Jan 13 07:49 prometheus-prometheus.yaml
-rw-r--r-- 1 root root     471 Jan 13 07:49 prometheus-roleBindingConfig.yaml
-rw-r--r-- 1 root root    1547 Jan 13 07:49 prometheus-roleBindingSpecificNamespaces.yaml
-rw-r--r-- 1 root root     366 Jan 13 07:49 prometheus-roleConfig.yaml
-rw-r--r-- 1 root root    1705 Jan 13 07:49 prometheus-roleSpecificNamespaces.yaml
-rw-r--r-- 1 root root   99658 Jan 13 07:49 prometheus-rules.yaml
-rw-r--r-- 1 root root     271 Jan 13 07:49 prometheus-serviceAccount.yaml
-rw-r--r-- 1 root root    6836 Jan 13 07:49 prometheus-serviceMonitorApiserver.yaml
-rw-r--r-- 1 root root     440 Jan 13 07:49 prometheus-serviceMonitorCoreDNS.yaml
-rw-r--r-- 1 root root    6355 Jan 13 07:49 prometheus-serviceMonitorKubeControllerManager.yaml
-rw-r--r-- 1 root root    7141 Jan 13 07:49 prometheus-serviceMonitorKubelet.yaml
-rw-r--r-- 1 root root     530 Jan 13 07:49 prometheus-serviceMonitorKubeScheduler.yaml
-rw-r--r-- 1 root root     527 Jan 13 07:49 prometheus-serviceMonitor.yaml
-rw-r--r-- 1 root root     613 Jan 13 08:32 prometheus-service.yaml
drwxr-xr-x 2 root root    4096 Jan 13 07:49 setup
3、修改promethes,alertmanager,grafana的service类型为NodePort类型
[root@master1 manifests]# cat prometheus-service.yaml
apiVersion: v1
kind: Service
metadata:
  labels:
    app.kubernetes.io/component: prometheus
    app.kubernetes.io/name: prometheus
    app.kubernetes.io/part-of: kube-prometheus
    app.kubernetes.io/version: 2.24.0
    prometheus: k8s
  name: prometheus-k8s
  namespace: monitoring
spec:
  type: NodePort # 新增
  ports:
  - name: web
    port: 9090
    targetPort: web
    nodePort: 30090 # 新增
  selector:
    app: prometheus
    app.kubernetes.io/component: prometheus
    app.kubernetes.io/name: prometheus
    app.kubernetes.io/part-of: kube-prometheus
    prometheus: k8s
  sessionAffinity: ClientIP
[root@master1 manifests]# cat alertmanager-service.yaml
apiVersion: v1
kind: Service
metadata:
  labels:
    alertmanager: main
    app.kubernetes.io/component: alert-router
    app.kubernetes.io/name: alertmanager
    app.kubernetes.io/part-of: kube-prometheus
    app.kubernetes.io/version: 0.21.0
  name: alertmanager-main
  namespace: monitoring
spec:
  type: NodePort # 新增
  ports:
  - name: web
    port: 9093
    targetPort: web
    nodePort: 30093 # 新增
  selector:
    alertmanager: main
    app: alertmanager
    app.kubernetes.io/component: alert-router
    app.kubernetes.io/name: alertmanager
    app.kubernetes.io/part-of: kube-prometheus
  sessionAffinity: ClientIP
[root@master1 manifests]# cat grafana-service.yaml
apiVersion: v1
kind: Service
metadata:
  labels:
    app: grafana
  name: grafana
  namespace: monitoring
spec:
  type: NodePort # 新增
  ports:
  - name: http
    port: 3000
    targetPort: http
    nodePort: 32000 # 新增
  selector:
    app: grafana
  type: NodePort
4、安装setup路径下的所有yaml文件
[root@master1 setup]# kubectl apply -f .
namespace/monitoring created
customresourcedefinition.apiextensions.k8s.io/alertmanagerconfigs.monitoring.coreos.com created
customresourcedefinition.apiextensions.k8s.io/alertmanagers.monitoring.coreos.com created
customresourcedefinition.apiextensions.k8s.io/podmonitors.monitoring.coreos.com created
customresourcedefinition.apiextensions.k8s.io/probes.monitoring.coreos.com created
customresourcedefinition.apiextensions.k8s.io/prometheuses.monitoring.coreos.com created
customresourcedefinition.apiextensions.k8s.io/prometheusrules.monitoring.coreos.com created
customresourcedefinition.apiextensions.k8s.io/servicemonitors.monitoring.coreos.com created
customresourcedefinition.apiextensions.k8s.io/thanosrulers.monitoring.coreos.com created
clusterrole.rbac.authorization.k8s.io/prometheus-operator created
clusterrolebinding.rbac.authorization.k8s.io/prometheus-operator created
deployment.apps/prometheus-operator created
service/prometheus-operator created
serviceaccount/prometheus-operator created
5、查看状态
[root@master1 setup]# kubectl get po -n monitoring
NAME                                   READY   STATUS    RESTARTS   AGE
prometheus-operator-78d4d97f4d-8pdh6   2/2     Running   0          17s
6、安装manifests路径下所有文件
[root@master1 manifests]# kubectl apply -f .
alertmanager.monitoring.coreos.com/main created
secret/alertmanager-main created
service/alertmanager-main created
serviceaccount/alertmanager-main created
servicemonitor.monitoring.coreos.com/alertmanager created
clusterrole.rbac.authorization.k8s.io/blackbox-exporter created
clusterrolebinding.rbac.authorization.k8s.io/blackbox-exporter created
configmap/blackbox-exporter-configuration created
deployment.apps/blackbox-exporter created
service/blackbox-exporter created
serviceaccount/blackbox-exporter created
servicemonitor.monitoring.coreos.com/blackbox-exporter created
secret/grafana-datasources created
configmap/grafana-dashboard-apiserver created
configmap/grafana-dashboard-cluster-total created
configmap/grafana-dashboard-controller-manager created
configmap/grafana-dashboard-k8s-resources-cluster created
configmap/grafana-dashboard-k8s-resources-namespace created
configmap/grafana-dashboard-k8s-resources-node created
configmap/grafana-dashboard-k8s-resources-pod created
configmap/grafana-dashboard-k8s-resources-workload created
configmap/grafana-dashboard-k8s-resources-workloads-namespace created
configmap/grafana-dashboard-kubelet created
configmap/grafana-dashboard-namespace-by-pod created
configmap/grafana-dashboard-namespace-by-workload created
configmap/grafana-dashboard-node-cluster-rsrc-use created
configmap/grafana-dashboard-node-rsrc-use created
configmap/grafana-dashboard-nodes created
configmap/grafana-dashboard-persistentvolumesusage created
configmap/grafana-dashboard-pod-total created
configmap/grafana-dashboard-prometheus-remote-write created
configmap/grafana-dashboard-prometheus created
configmap/grafana-dashboard-proxy created
configmap/grafana-dashboard-scheduler created
configmap/grafana-dashboard-statefulset created
configmap/grafana-dashboard-workload-total created
configmap/grafana-dashboards created
deployment.apps/grafana created
service/grafana created
serviceaccount/grafana created
servicemonitor.monitoring.coreos.com/grafana created
clusterrole.rbac.authorization.k8s.io/kube-state-metrics created
clusterrolebinding.rbac.authorization.k8s.io/kube-state-metrics created
deployment.apps/kube-state-metrics created
service/kube-state-metrics created
serviceaccount/kube-state-metrics created
servicemonitor.monitoring.coreos.com/kube-state-metrics created
clusterrole.rbac.authorization.k8s.io/node-exporter created
clusterrolebinding.rbac.authorization.k8s.io/node-exporter created
daemonset.apps/node-exporter created
service/node-exporter created
serviceaccount/node-exporter created
servicemonitor.monitoring.coreos.com/node-exporter created
apiservice.apiregistration.k8s.io/v1beta1.metrics.k8s.io created
clusterrole.rbac.authorization.k8s.io/prometheus-adapter created
clusterrole.rbac.authorization.k8s.io/system:aggregated-metrics-reader created
clusterrolebinding.rbac.authorization.k8s.io/prometheus-adapter created
clusterrolebinding.rbac.authorization.k8s.io/resource-metrics:system:auth-delegator created
clusterrole.rbac.authorization.k8s.io/resource-metrics-server-resources created
configmap/adapter-config created
deployment.apps/prometheus-adapter created
rolebinding.rbac.authorization.k8s.io/resource-metrics-auth-reader created
service/prometheus-adapter created
serviceaccount/prometheus-adapter created
servicemonitor.monitoring.coreos.com/prometheus-adapter created
clusterrole.rbac.authorization.k8s.io/prometheus-k8s created
clusterrolebinding.rbac.authorization.k8s.io/prometheus-k8s created
servicemonitor.monitoring.coreos.com/prometheus-operator created
prometheus.monitoring.coreos.com/k8s created
rolebinding.rbac.authorization.k8s.io/prometheus-k8s-config created
rolebinding.rbac.authorization.k8s.io/prometheus-k8s created
rolebinding.rbac.authorization.k8s.io/prometheus-k8s created
rolebinding.rbac.authorization.k8s.io/prometheus-k8s created
role.rbac.authorization.k8s.io/prometheus-k8s-config created
role.rbac.authorization.k8s.io/prometheus-k8s created
role.rbac.authorization.k8s.io/prometheus-k8s created
role.rbac.authorization.k8s.io/prometheus-k8s created
prometheusrule.monitoring.coreos.com/prometheus-k8s-rules created
service/prometheus-k8s created
serviceaccount/prometheus-k8s created
servicemonitor.monitoring.coreos.com/prometheus created
servicemonitor.monitoring.coreos.com/kube-apiserver created
servicemonitor.monitoring.coreos.com/coredns created
servicemonitor.monitoring.coreos.com/kube-controller-manager created
servicemonitor.monitoring.coreos.com/kube-scheduler created
servicemonitor.monitoring.coreos.com/kubelet created
7、查看状态
[root@master1 ~]# kubectl get pod -n monitoring
NAME                                   READY   STATUS    RESTARTS   AGE
alertmanager-main-0                    2/2     Running   0          7m13s
alertmanager-main-1                    2/2     Running   0          7m13s
alertmanager-main-2                    2/2     Running   0          7m13s
blackbox-exporter-6f998d5c46-8wd6h     3/3     Running   0          7m13s
grafana-9cf59f9dc-rkwpr                1/1     Running   0          7m11s
kube-state-metrics-598b6577d9-p2kzl    3/3     Running   0          7m12s
node-exporter-5jr9j                    2/2     Running   0          7m10s
node-exporter-9mqgz                    2/2     Running   0          7m10s
node-exporter-gx57w                    2/2     Running   0          7m10s
node-exporter-hv9l4                    2/2     Running   0          7m10s
prometheus-adapter-7586ffcbdb-dfw64    1/1     Running   0          7m8s
prometheus-k8s-0                       2/2     Running   1          7m7s
prometheus-k8s-1                       2/2     Running   1          7m7s
prometheus-operator-78d4d97f4d-8pdh6   2/2     Running   0          7m47s
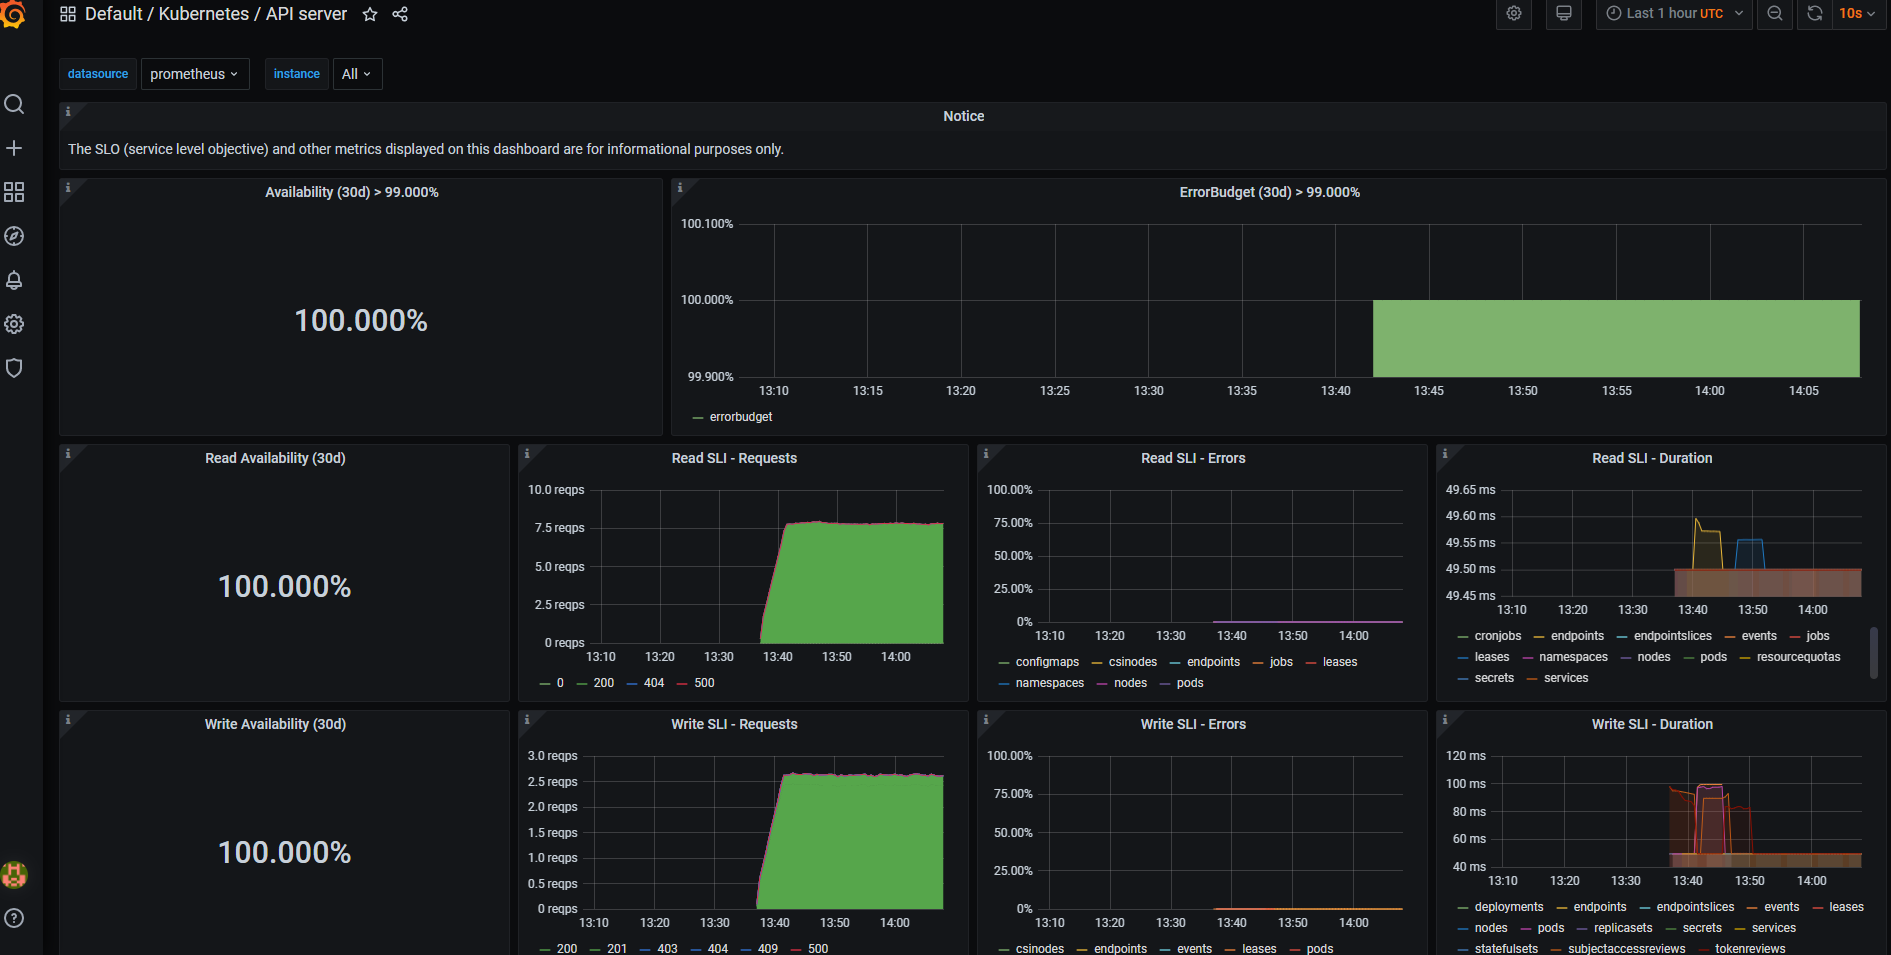
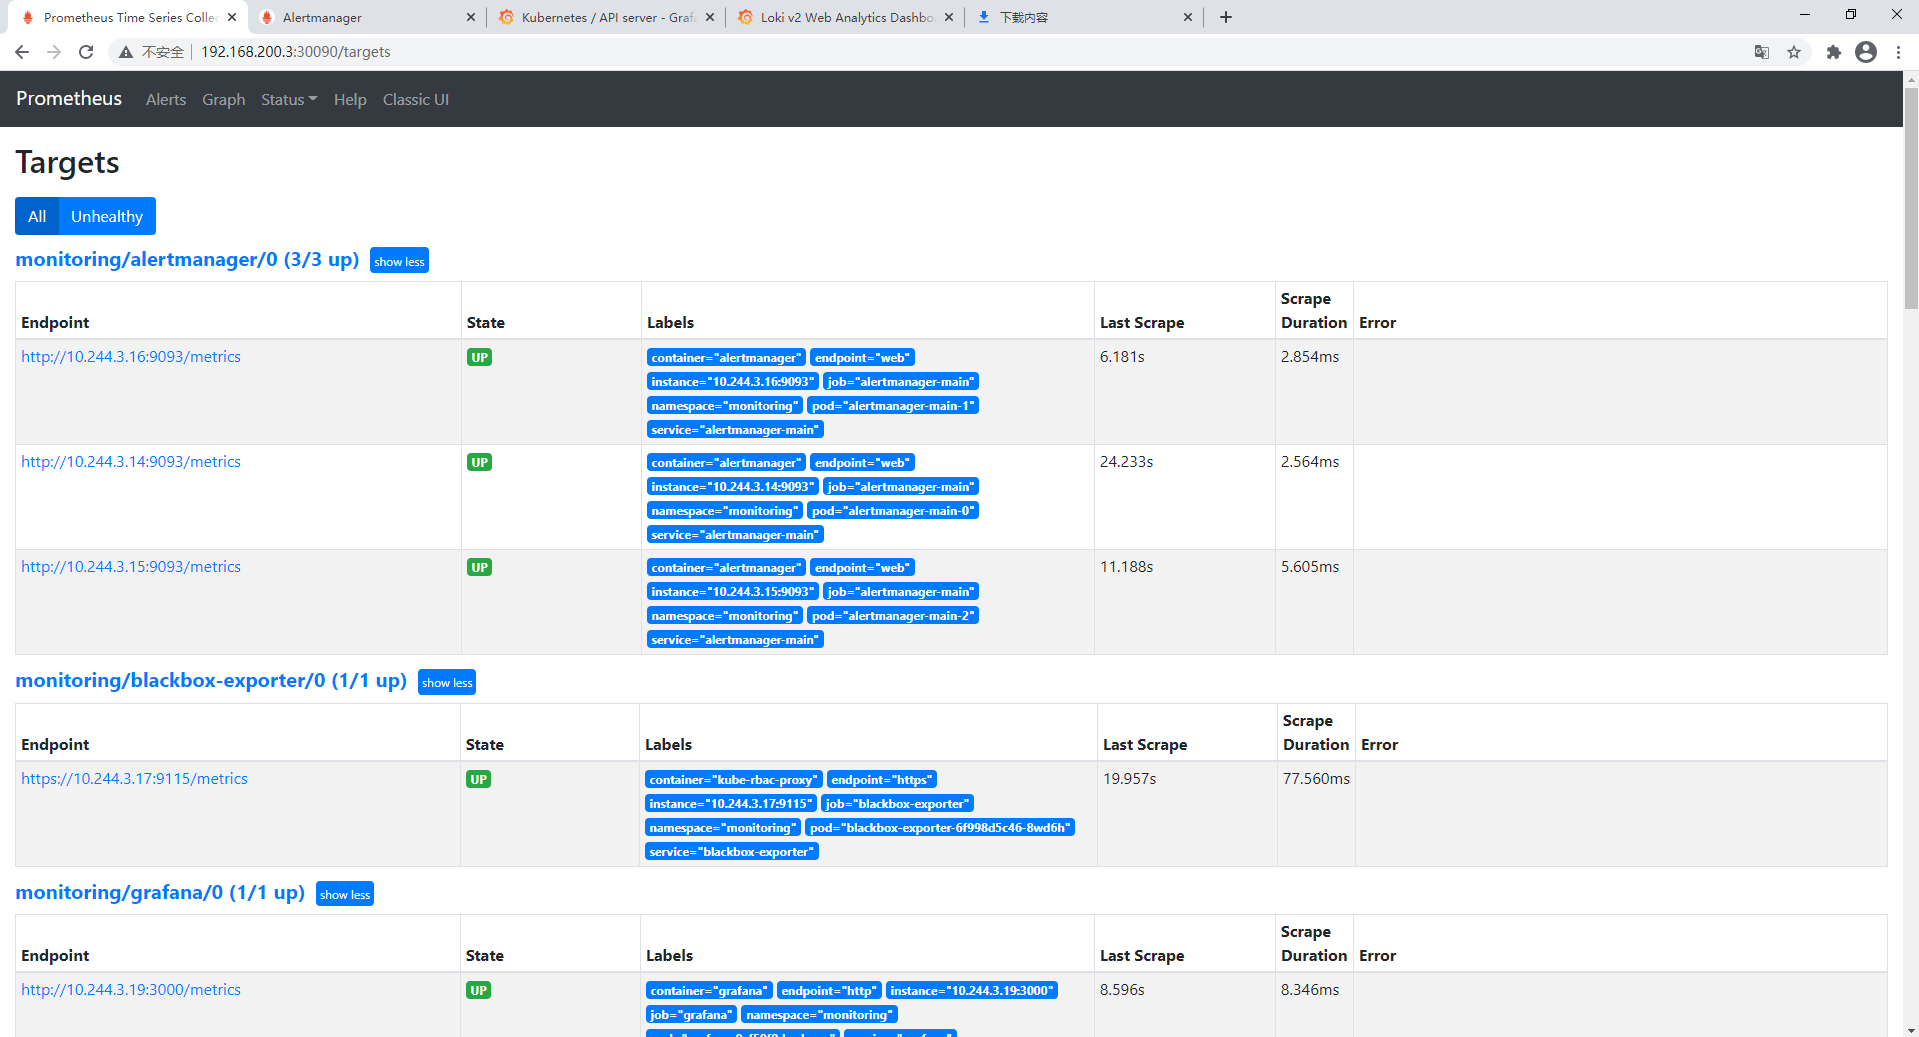
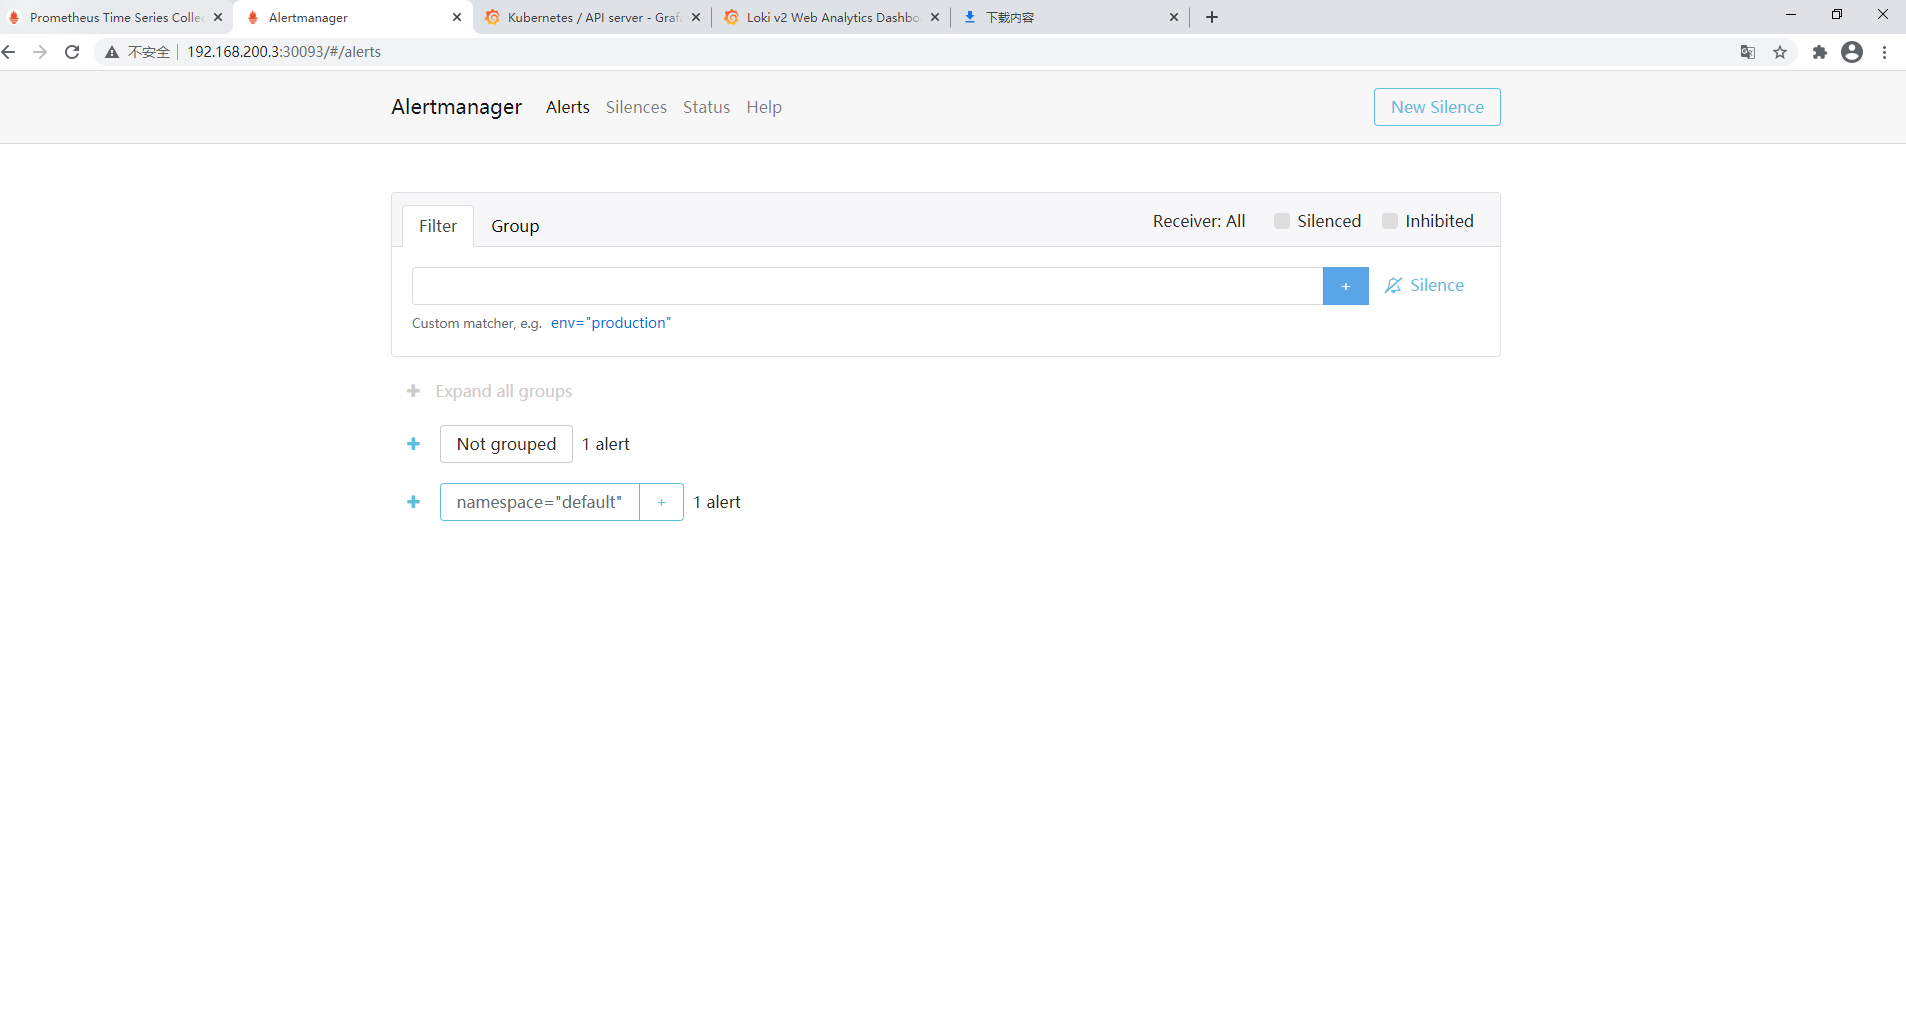
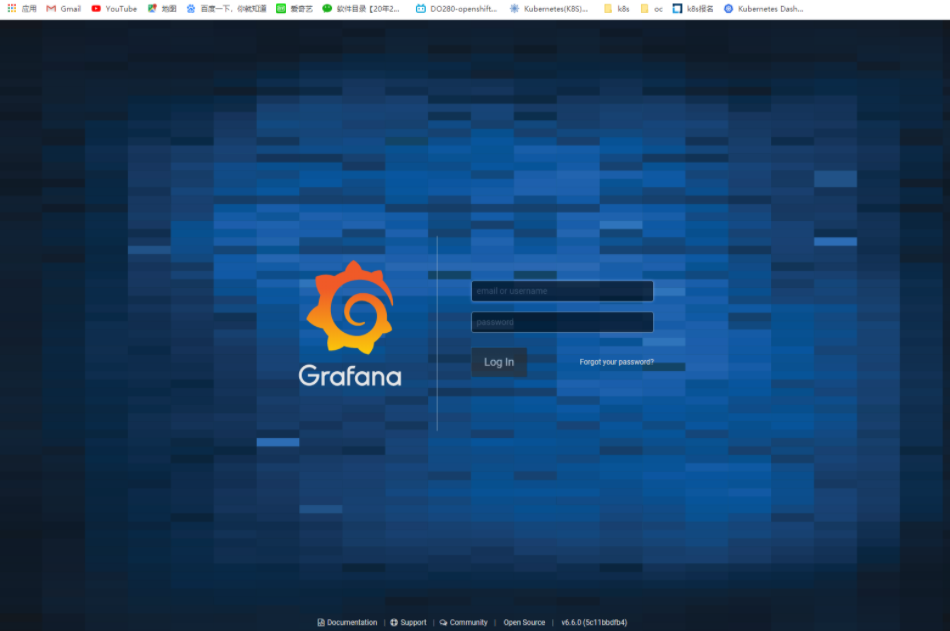
8、访问prometheus,alert-manager,grafana
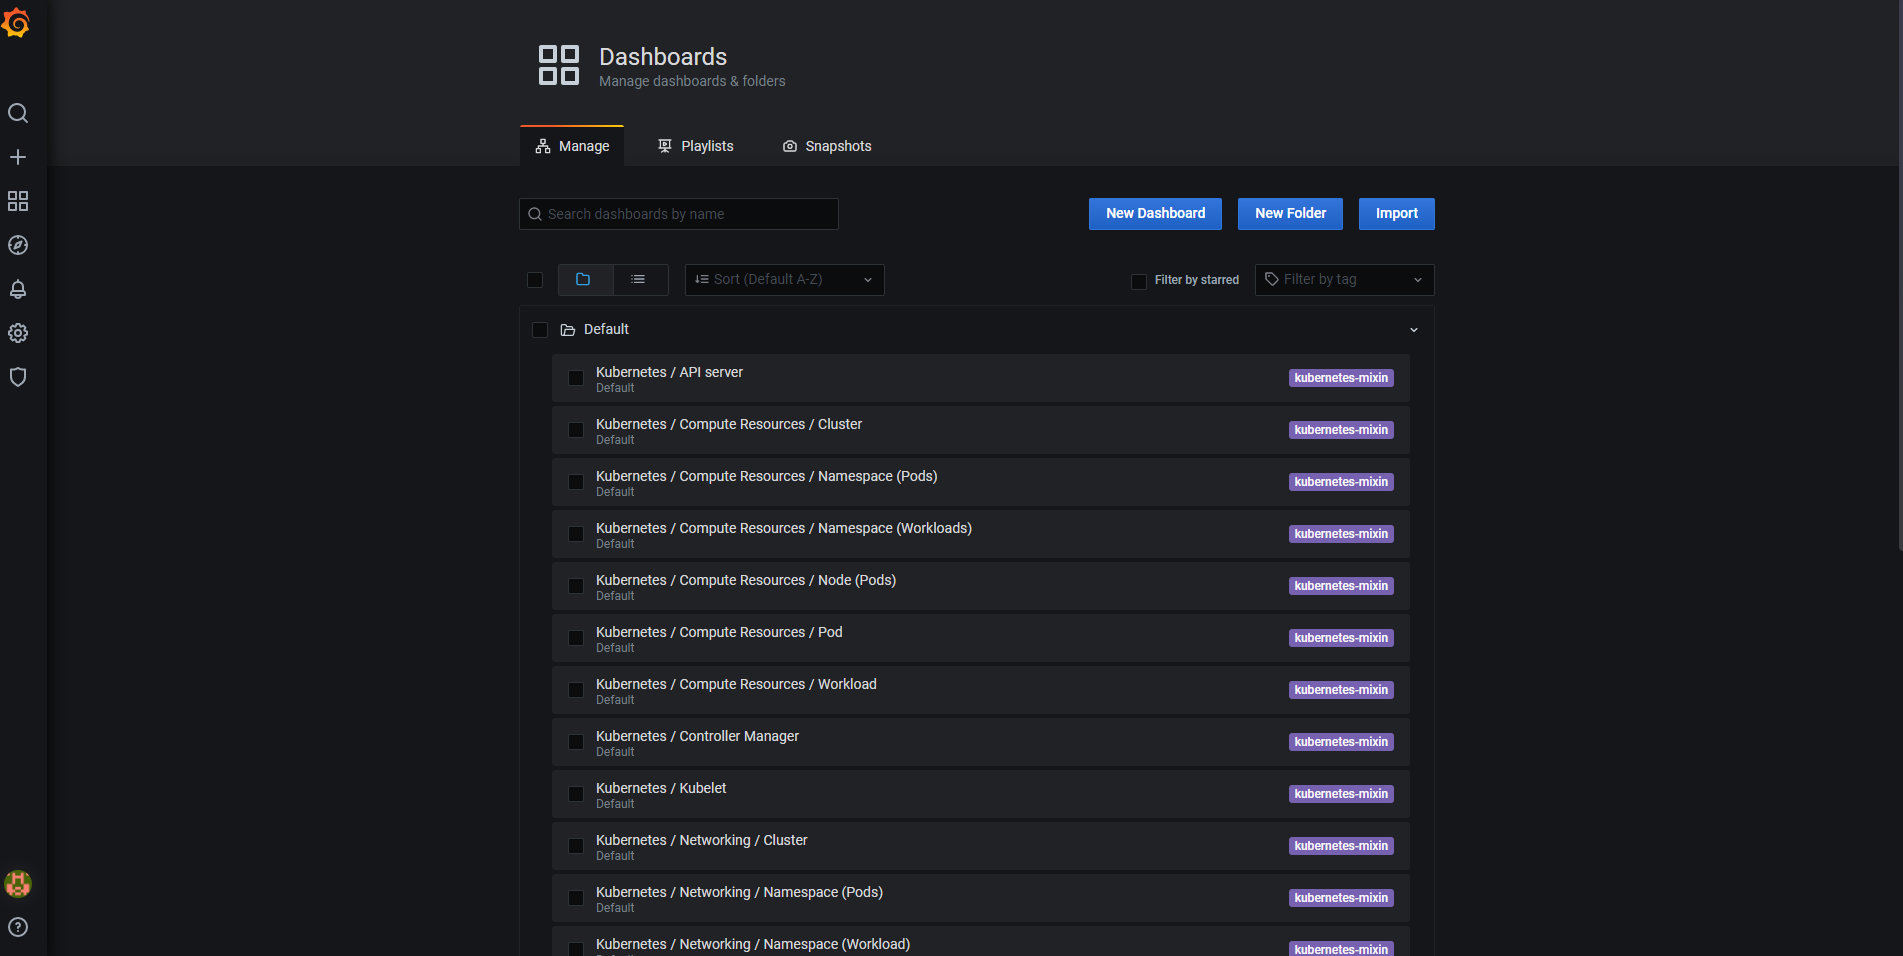
9、模板grafana有很多自带的可以随便选择一个就行