最近公司业务上的 需求,要求做一些图表,我们技术框架上选择方便使用的Echarts.
下面是效果图:
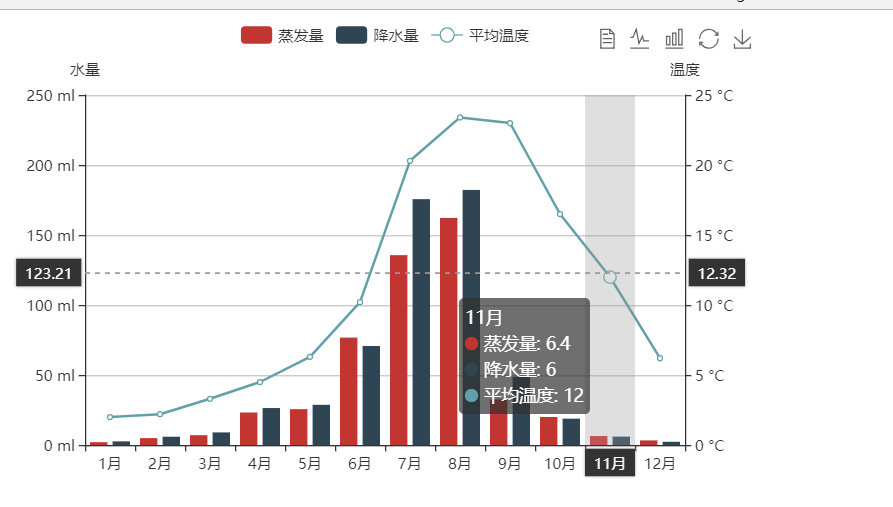
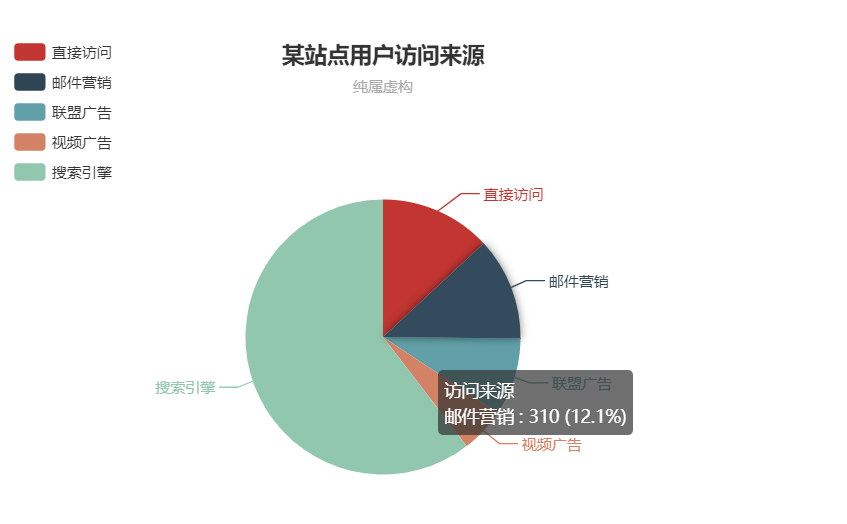
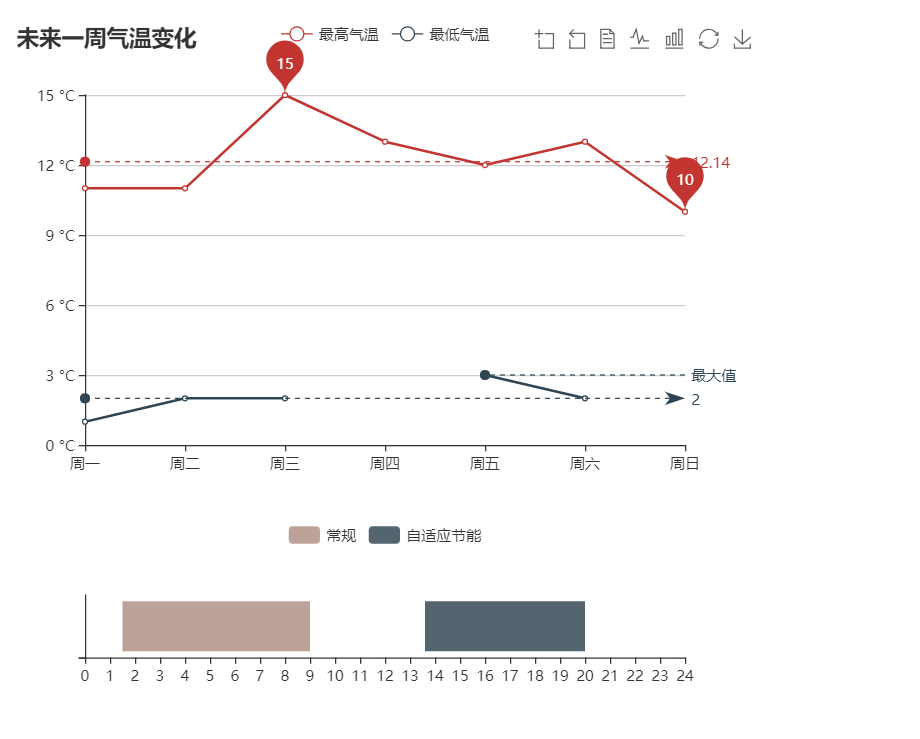
下面是具体代码:
<!DOCTYPE html>
<html>
<head>
    <meta charset="utf-8">
    <title>折柱混合</title>
    <!-- 引入 echarts.js -->
    <script src="https://cdn.bootcss.com/echarts/4.1.0.rc2/echarts.min.js"></script>
</head>
<body>
<!-- 为ECharts准备一个具备大小(宽高)的Dom -->
<div id="main" style=" 600px;height:400px;"></div>
<div id="main2" style=" 600px;height:400px;"></div>
<div id="main3" style=" 600px;height:400px;"></div>
<div id="main4" style=" 600px;height:400px;"></div>
<script type="text/javascript">
    // 基于准备好的dom,初始化echarts实例
    var myChart = echarts.init(document.getElementById('main'));
    var myChart2 = echarts.init(document.getElementById('main2'));
    var myChart3 = echarts.init(document.getElementById('main3'));
    var myChart4 = echarts.init(document.getElementById('main4'));

    //app.title = '折柱混合';

    option = {
        tooltip: {
            trigger: 'axis',
            axisPointer: {
                type: 'cross',
                crossStyle: {
                    color: '#999'
                }
            }
        },
        toolbox: {
            feature: {
                dataView: {show: true, readOnly: false},
                magicType: {show: true, type: ['line', 'bar']},
                restore: {show: true},
                saveAsImage: {show: true}
            }
        },
        legend: {
            data:['蒸发量','降水量','平均温度']
        },
        xAxis: [
            {
                type: 'category',
                data: ['1月','2月','3月','4月','5月','6月','7月','8月','9月','10月','11月','12月'],
                axisPointer: {
                    type: 'shadow'
                }
            }
        ],
        yAxis: [
            {
                type: 'value',
                name: '水量',
                min: 0,
                max: 250,
                interval: 50,
                axisLabel: {
                    formatter: '{value} ml'
                }
            },
            {
                type: 'value',
                name: '温度',
                min: 0,
                max: 25,
                interval: 5,
                axisLabel: {
                    formatter: '{value} °C'
                }
            }
        ],
        series: [
            {
                name:'蒸发量',
                type:'bar',
                data:[2.0, 4.9, 7.0, 23.2, 25.6, 76.7, 135.6, 162.2, 32.6, 20.0, 6.4, 3.3]
            },
            {
                name:'降水量',
                type:'bar',
                data:[2.6, 5.9, 9.0, 26.4, 28.7, 70.7, 175.6, 182.2, 48.7, 18.8, 6.0, 2.3]
            },
            {
                name:'平均温度',
                type:'line',
                yAxisIndex: 1,
                data:[2.0, 2.2, 3.3, 4.5, 6.3, 10.2, 20.3, 23.4, 23.0, 16.5, 12.0, 6.2]
            }
        ]
    };
    option2 = {
        title : {
            text: '某站点用户访问来源',
            subtext: '纯属虚构',
            x:'center'
        },
        tooltip : {
            trigger: 'item',
            formatter: "{a} <br/>{b} : {c} ({d}%)"
        },
        legend: {
            orient: 'vertical',
            left: 'left',
            data: ['直接访问','邮件营销','联盟广告','视频广告','搜索引擎']
        },
        series : [
            {
                name: '访问来源',
                type: 'pie',
                radius : '55%',
                center: ['50%', '60%'],
                data:[
                    {value:335, name:'直接访问'},
                    {value:310, name:'邮件营销'},
                    {value:234, name:'联盟广告'},
                    {value:135, name:'视频广告'},
                    {value:1548, name:'搜索引擎'}
                ],
                itemStyle: {
                    emphasis: {
                        shadowBlur: 10,
                        shadowOffsetX: 0,
                        shadowColor: 'rgba(0, 0, 0, 0.5)'
                    }
                }
            }
        ]
    };
    option3 = {
        title: {
        text: '未来一周气温变化',
        },
        tooltip: {
            trigger: 'axis'
        },
        legend: {
            data:['最高气温','最低气温']
        },
        toolbox: {
            show: true,
            feature: {
                dataZoom: {
                    yAxisIndex: 'none'
                },
                dataView: {readOnly: false},
                magicType: {type: ['line', 'bar']},
                restore: {},
                saveAsImage: {}
            }
        },
        xAxis:  {
            type: 'category',
            boundaryGap: false,
            data: ['周一','周二','周三','周四','周五','周六','周日']
        },
        yAxis: {
            type: 'value',
            axisLabel: {
                formatter: '{value} °C'
            }
        },
        series: [
            {
                name:'最高气温',
                type:'line',
                data:[11, 11, 15, 13, 12, 13, 10],
                markPoint: {
                    data: [
                        {type: 'max', name: '最大值'},
                        {type: 'min', name: '最小值'}
                    ]
                },
                markLine: {
                    data: [
                        {type: 'average', name: '平均值'}
                    ]
                }
            },
            {
                name:'最低气温',
                type:'line',
                data:[1, 2, 2, '', 3, 2, ],
                markPoint: {
                    data: [
                        {name: '周最低', value: -2, xAxis: 1, yAxis: -1.5}
                    ]
                },
                markLine: {
                    data: [
                        {type: 'average', name: '平均值'},
                        [{
                            symbol: 'none',
                            x: '90%',
                            yAxis: 'max'
                        }, {
                            symbol: 'circle',
                            label: {
                                normal: {
                                    position: 'start',
                                    formatter: '最大值'
                                }
                            },
                            type: 'max',
                            name: '最高点'
                        }]
                    ]
                }
            }
        ]
        };
    option4 = {
        tooltip:{
            show:false
        },
        legend: {
            data: ['1', '常规','1','自适应节能','1'],

        },
        color:[ 'transparent', '#bda29a','transparent', '#546570', 'transparent'],
        grid: {
            height:50
        },
        xAxis:  {
            type: 'value',
            min: 0,
            max: 24,
            maxInterval: 1,
            splitLine:{
                show:false
            },


        },
        yAxis: {
            type: 'category',
            data: [''],

        },
        series: [
            {
                name: '',
                type: 'bar',
                stack: '总量',
                label: {
                    normal: {
                        show: false,
                    }
                },
                data: [1.5]
            },
            {
                name: '常规',
                type: 'bar',
                stack: '总量',
                label: {
                    normal: {
                         show: false,
                        //show: true,

                    }
                },
                data: [7.5]
            },
            {
                name: '',
                type: 'bar',
                stack: '总量',
                label: {
                    normal: {
                         show: false,
                        //show: true,

                    }
                },
                data: [4.6]
            },
            {
                name: '自适应节能',
                type: 'bar',
                stack: '总量',
                label: {
                    normal: {
                         show: false,
                        //show: true,

                    }
                },
                data: [6.4]
            },
            {
                name: '',
                type: 'bar',
                stack: '总量',
                label: {
                    normal: {
                        show: true,

                    }
                },
                data: [2]
            }
        ]
    };
    // 使用刚指定的配置项和数据显示图表。
    myChart.setOption(option);
    myChart2.setOption(option2);
    myChart3.setOption(option3);
    myChart4.setOption(option4);

</script>
</body>
</html>