title 标题(大小标题)
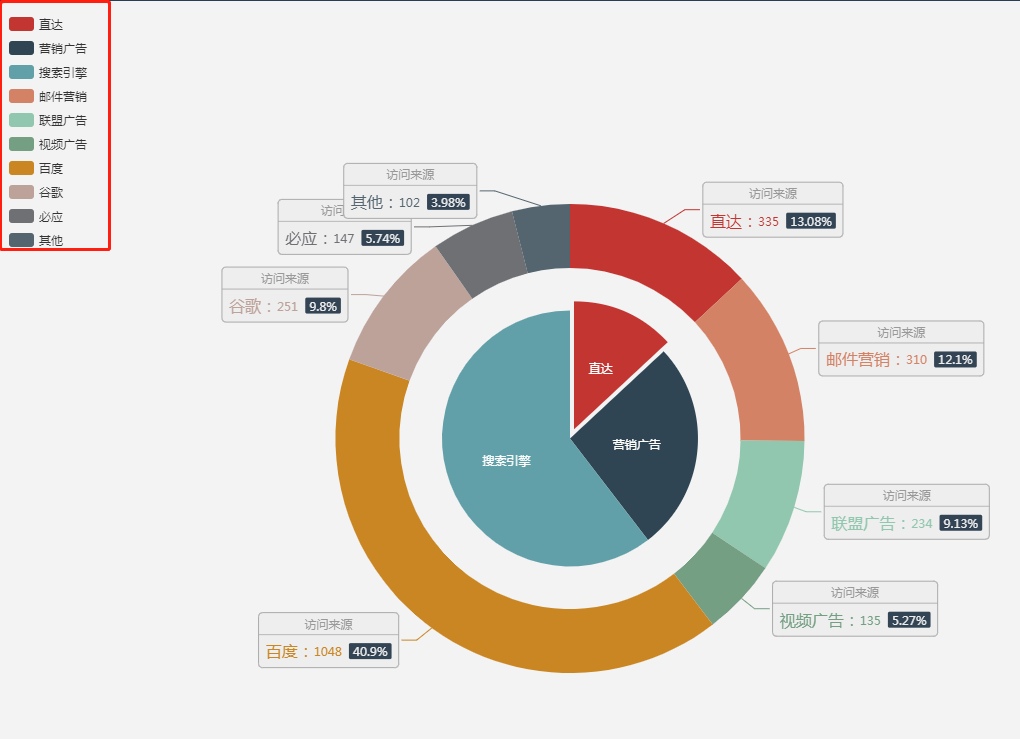
legend 图例组件(series有多个对象时有用)
grid 图的位置,大小等
xAxis x坐标轴 (axisTick: x轴刻度线、splitLine: x间隙、axisLine: x轴线、axisLabel: x坐标轴刻度标签)
yAxis y坐标轴 (axisTick: y轴刻度线、splitLine: y间隙、axisLine: y轴线、axisLabel: y坐标轴刻度标签)
toolbox 工具(下载canvas图片等)
tooltip 鼠标悬停提示
color 全局颜色组
backgroundColor 全局背景颜色
textStyle 全局的字体样式
(G2、Highcharts、google echarts)
例子:
1.
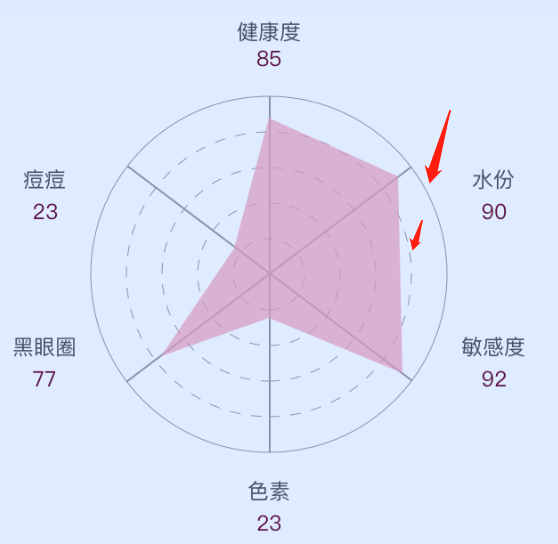
① radar图:
splitNumber (从圆点到最外有多少个圆圈)
splitLine (圆圈的样式)
axisLine (从圆点到最外直线的样式)
splitArea (从圆点到最外圈层的样式)
splitLine 的type只能一种,但能画两个
2.
(微信小程序版)
3.
柱状图每个都不同颜色


 1 series : [
 2     {
 3         type:'bar',
 4         itemStyle: {                            //  图形样式
 5             normal:{
 6                 color: function (params){
 7                     let aDataMachine1 = [];
 8                     var colorList = [];
 9                     for(let i=0; i<aDataMachine.length; i++){
10                         aDataMachine1.push(aDataMachine[i])
11                     }
12                     aDataMachine1.sort(function (a,b){
13                         return b.number-a.number
14                     });
15                     for(let i=0; i<aDataMachine.length; i++){
16                         if (aDataMachine[i].number == aDataMachine1[0].number) {
17                             colorList.push('rgb(0,255,255)');
18                         } else if(aDataMachine[i].number == aDataMachine1[1].number) {
19                             colorList.push('rgb(42,170,227)');
20                         } else {
21                             colorList.push('rgb(195,229,235)')
22                         }
23                     }
24                     return colorList[params.dataIndex];
25                 }
26             },
27         },
28     }
29 ],
三、有赞vue组件