移动端写一个图表引用echarts,highcharts插件,本次要找一个能够显示最新数据的折线图,最后只找到显示最大值;
找到echarts的实例;记一下个各功能。
<!DOCTYPE html>
<html style="height: 100%">
<head>
<meta charset="utf-8">
<script type="text/javascript" src="echarts/echarts.min.js"></script>
<script type="text/javascript" src="echarts/echarts-gl.min.js"></script>
<script type="text/javascript" src="echarts/ecStat.min.js"></script>
<script type="text/javascript" src="echarts/dataTool.min.js"></script>
<script type="text/javascript" src="echarts/china.js"></script>
<script type="text/javascript" src="echarts/world.js"></script>
<!-- <script type="text/javascript" src="echarts/api.js"></script> -->
<script type="text/javascript" src="echarts/bmap.min.js"></script>
<script type="text/javascript" src="echarts/simplex.js"></script>
</head>
<body style="height: 100%; margin: 0">
<div id="container" style="height: 100%"></div>
<script type="text/javascript">
var dom = document.getElementById("container");
var myChart = echarts.init(dom);
var app = {};
option = null;
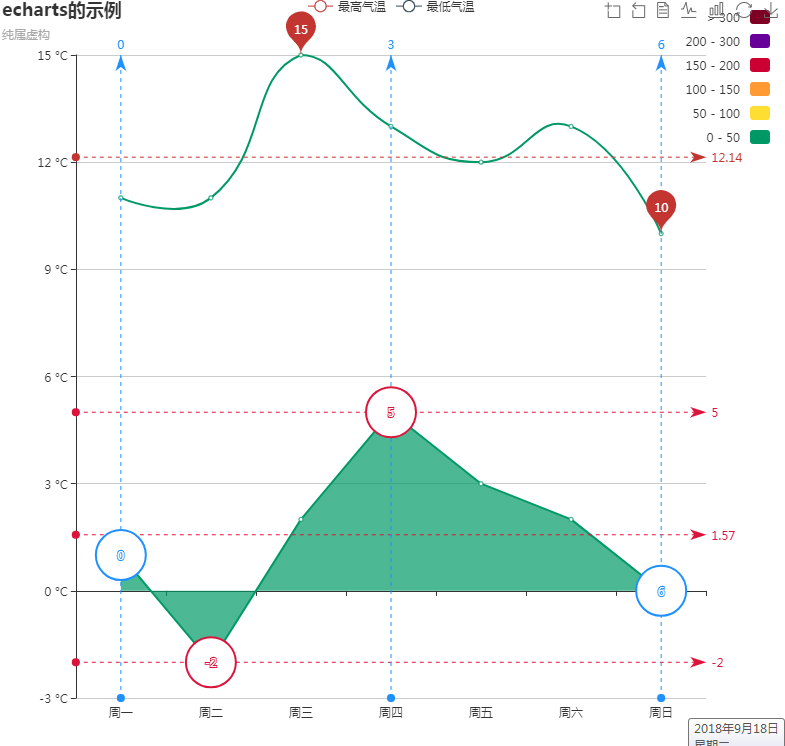
option = {
title: {
text: 'echarts的示例',//标题
subtext: '纯属虚构',//标题2
},
tooltip: {
trigger: 'axis',
},
legend: {
data: ['最高气温', '最低气温']
},
toolbox: {//控制上的小按钮
show: true,
feature: {
dataZoom: {
yAxisIndex: 'none'
},
dataView: { readOnly: false },
magicType: { type: ['line', 'bar'] },
restore: {},
saveAsImage: {}
}
},
xAxis: {
type: 'category',
boundaryGap: true,//控制是否靠边
data: ['周一', '周二', '周三', '周四', '周五', '周六', '周日']
},
yAxis: {
type: 'value',
axisLabel: {
formatter: '{value} °C'//y轴的单位
}
},
dataZoom: [{//滚动条
startValue: '2014-06-01',
show: false,//显示,隐藏滚动条;
}, {
type: 'inside'
}],
visualMap: {//控制折线曲线颜色
top: 10,
right: 10,
pieces: [{
gt: 0,
lte: 50,
color: '#096'
}, {
gt: 50,
lte: 100,
color: '#ffde33'
}, {
gt: 100,
lte: 150,
color: '#ff9933'
}, {
gt: 150,
lte: 200,
color: '#cc0033'
}, {
gt: 200,
lte: 300,
color: '#660099'
}, {
gt: 300,
color: '#7e0023'
}],
outOfRange: {
color: '#999'
}
},
series: [
{//第一条线
name: '最高气温',
type: 'line',
smooth: true,//尖锐、圆弧
data: [11, 11, 15, 13, 12, 13, 10],
markPoint: {//最大、小值汽泡
data: [
{ type: 'max', name: '最大值' },
{ type: 'min', name: '最小值' }
]
},
markLine: {
data: [
{ type: 'average', name: '平均值' }
]
}
},
{//第2条线
name: '最低气温',
type: 'line',
areaStyle: {},
data: [1, -2, 2, 5, 3, 2, 0],
markPoint: {
data: [
{ name: '周最低', value: -2, xAxis: 1, yAxis: -1.5 }
]
},
markPoint: {
data: [
// 纵轴,默认
{ type: 'max', name: '最大值',
symbol: 'emptyCircle',
itemStyle: {
normal: {
color: '#dc143c',
label: {
position: 'top'
}
}
}
},
{ type: 'min', name: '最小值',
symbol: 'emptyCircle',
itemStyle: {
normal: {
color: '#dc143c',
label: {
position: 'bottom'
}
}
}
},
// 横轴
{ type: 'max',
name: '最大值',
valueIndex: 0,
symbol: 'emptyCircle',
itemStyle: {
normal: {
color: '#1e90ff',
label: {
position: 'right'
}
}
}
},
{ type: 'min',
name: '最小值',
valueIndex: 0,
symbol: 'emptyCircle',
itemStyle: {
normal: {
color: '#1e90ff',
label: {
position: 'left'
}
}
}
}
]
},
markLine: {
data: [
// 纵轴,默认
{ type: 'max', name: '最大值', itemStyle: { normal: { color: '#dc143c' } } },
{ type: 'min', name: '最小值', itemStyle: { normal: { color: '#dc143c' } } },
{ type: 'average', name: '平均值', itemStyle: { normal: { color: '#dc143c' } } },
// 横轴
{ type: 'max', name: '最大值', valueIndex: 0, itemStyle: { normal: { color: '#1e90ff' } } },
{ type: 'min', name: '最小值', valueIndex: 0, itemStyle: { normal: { color: '#1e90ff' } } },
{ type: 'average', name: '平均值', valueIndex: 0, itemStyle: { normal: { color: '#1e90ff' } } }
]
}
},
],
markLine: {
data: [
{ type: 'average', name: '平均值' },
[{
symbol: 'none',
x: '90%',
yAxis: 'max'
}, {
symbol: 'circle',
label: {
normal: {
position: 'start',
formatter: '最大值'
}
},
type: 'max',
name: '最高点'
}]
]
},
}
;
if (option && typeof option === "object") {
myChart.setOption(option, true);
}
</script>
</body>
</html>