一。 ELK介绍
ELK 是elastic公司提供的一套完整的日志收集、展示解决方案,是三个产品的首字母缩写,分别是ElasticSearch、Logstash 和 Kibana。
- ElasticSearch简称ES,它是一个实时的分布式搜索和分析引擎,它可以用于全文搜索,结构化搜索以及分析。
- 它是一个建立在全文搜索引擎 Apache Lucene 基础上的搜索引擎,使用 Java 语言编写。
- Logstash是一个具有实时传输能力的数据收集引擎,用来进行数据收集(如:读取文本文件)、解析,并将数据发送给ES。Kibana为 Elasticsearch 提供了分析和可视化的 Web 平台。它可以在 Elasticsearch 的索引中查找,交互数据,并生成各种维度表格、图形。
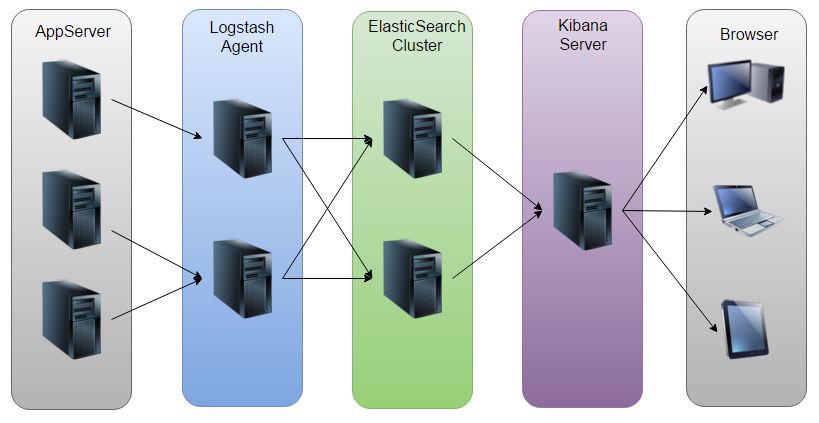
一般收集日志的步骤是 不同的应用 安装logstashagent负责收集日志 将日志集中写入elasticsearch集群 同时将 用户可以使用kabana可视化界面 分析统计日志
二。logstash介绍
logstash收集来自不同源头的数据 格式化后输出到对应的目标分析器,logstash有用丰富多彩的inputs filters outputs插件拓展的日志手机功能
input表示收集日志来源的插件 比如filebeat读取本地文件日志 rsyslog可以收集系统日志
filters对于发送的每条日志进行格式化处理的插件
outputs表示最终输出的目的地 可以是数据库 消息队列 也可以是elasticsearch
1》安装logstash
添加用户和权限组
groupadd es
useradd es -g es
passwd essu - eswget https://artifacts.elastic.co/downloads/logstash/logstash-5.6.4.tar.gztar zxvf logstash-5.6.4.tar.gz./logstash -e 'input { stdin { } } output { stdout {} }'[es@bogon bin]$ ./logstash -e 'input { stdin { } } output { stdout {} }'
Sending Logstash's logs to /home/es/logstash-5.6.4/logs which is now configured via log4j2.properties
[2017-12-12T20:21:01,909][INFO ][logstash.modules.scaffold] Initializing module {:module_name=>"fb_apache", :directory=>"/home/es/logstash-5.6.4/modules/fb_apache/configuration"}
[2017-12-12T20:21:01,930][INFO ][logstash.modules.scaffold] Initializing module {:module_name=>"netflow", :directory=>"/home/es/logstash-5.6.4/modules/netflow/configuration"}
[2017-12-12T20:21:02,519][INFO ][logstash.pipeline ] Starting pipeline {"id"=>"main", "pipeline.workers"=>1, "pipeline.batch.size"=>125, "pipeline.batch.delay"=>5, "pipeline.max_inflight"=>125}
[2017-12-12T20:21:03,066][INFO ][logstash.pipeline ] Pipeline main started
The stdin plugin is now waiting for input:
[2017-12-12T20:21:03,392][INFO ][logstash.agent ] Successfully started Logstash API endpoint {:port=>9600}
hello
2017-12-12T12:21:49.350Z 0.0.0.0 hello
jiaozi2》演示使用logstash收集httpd日志(参考https://www.elastic.co/guide/en/beats/filebeat/5.6/filebeat-installation.html)
演示环境
192.168.58.149 httpd 日志文件/var/log/httpd/access_log  安装filebeat收集
192.168.58.152 logstash接受来自filebeat日志
192.168.58.147 elasticsearch》》149安装httpd和filebeat
安装httpd
yum -y install httpd
service httpd starttail -f /var/log/httpd/access_loghttp://192.168.58.149/192.168.58.1 - - [12/Dec/2017:19:55:25 -0800] "GET / HTTP/1.1" 403 4897 "-" "Mozilla/5.0 (compatible; MSIE 10.0; Windows NT 6.1; WOW64; Trident/6.0)"
192.168.58.1 - - [12/Dec/2017:19:55:25 -0800] "GET /noindex/css/bootstrap.min.css HTTP/1.1" 200 19341 "http://192.168.58.149/" "Mozilla/5.0 (compatible; MSIE 10.0; Windows NT 6.1; WOW64; Trident/6.0)"
192.168.58.1 - - [12/Dec/2017:19:55:25 -0800] "GET /images/poweredby.png HTTP/1.1" 200 3956 "http://192.168.58.149/" "Mozilla/5.0 (compatible; MSIE 10.0; Windows NT 6.1; WOW64; Trident/6.0)"
192.168.58.1 - - [12/Dec/2017:19:55:25 -0800] "GET /noindex/css/open-sans.css HTTP/1.1" 200 5081 "http://192.168.58.149/" "Mozilla/5.0 (compatible; MSIE 10.0; Windows NT 6.1; WOW64; Trident/6.0)"安装filebeat(安装配置参考https://www.elastic.co/guide/en/beats/filebeat/5.6/filebeat-installation.html)
curl -L -O https://artifacts.elastic.co/downloads/beats/filebeat/filebeat-5.6.5-x86_64.rpm
rpm -vih filebeat-5.6.5-x86_64.rpm
[root@node2 ~]# rpm -ql filebeat-5.6.5-1.x86_64
/etc/filebeat/filebeat.full.yml
/etc/filebeat/filebeat.template-es2x.json
/etc/filebeat/filebeat.template-es6x.json
/etc/filebeat/filebeat.template.json
/etc/filebeat/filebeat.yml
/etc/init.d/filebeatfilebeat.prospectors:
- input_type: log
#日志文件的路径
paths:
- /var/log/httpd/access_log
#注释掉output.elasticsearch 表示写出到elasticsearch 我们要写入到logstash 注释掉
#output.elasticsearch:
# hosts: ["localhost:9200"]
#打开以下代码
output.logstash:
# logstash使用了input需要配置开启5044端口
hosts: ["192.168.58.152:5044"]
[root@node2 filebeat]# cd /etc/filebeat && /usr/share/filebeat/bin/filebeat -configtest -e
2017/12/13 04:54:30.134898 beat.go:297: INFO Home path: [/usr/share/filebeat/bin] Config path: [/usr/share/filebeat/bin] Data path: [/usr/share/filebeat/bin/data] Logs path: [/usr/share/filebeat/bin/logs]
2017/12/13 04:54:30.134981 beat.go:192: INFO Setup Beat: filebeat; Version: 5.6.5
2017/12/13 04:54:30.135144 logstash.go:91: INFO Max Retries set to: 3
2017/12/13 04:54:30.135279 outputs.go:108: INFO Activated logstash as output plugin.
2017/12/13 04:54:30.135448 publish.go:300: INFO Publisher name: node2
2017/12/13 04:54:30.136108 async.go:63: INFO Flush Interval set to: 1s
2017/12/13 04:54:30.136136 async.go:64: INFO Max Bulk Size set to: 2048
2017/12/13 04:54:30.136332 modules.go:95: ERR Not loading modules. Module directory not found: /usr/share/filebeat/bin/module
Config OK/etc/init.d/filebeat start添加logstash配置文件 随便添加一个文件my.cnf,内容:
表示使用beats插件 开启一个端口5044 之前filebeat配置就可以提交到这个端口
input {
    beats {
        port => "5044"
    }
}
# The filter part of this file is commented out to indicate that it is
# optional.
# filter {
#
# }
#输出到控制台
output {
    stdout { codec => rubydebug }
}[es@bogon logstash-5.6.4]$ bin/logstash -f config/my.conf --config.test_and_exit
Sending Logstash's logs to /home/es/logstash-5.6.4/logs which is now configured via log4j2.properties
[2017-12-12T23:19:12,697][INFO ][logstash.modules.scaffold] Initializing module {:module_name=>"fb_apache", :directory=>"/home/es/logstash-5.6.4/modules/fb_apache/configuration"}
[2017-12-12T23:19:12,733][INFO ][logstash.modules.scaffold] Initializing module {:module_name=>"netflow", :directory=>"/home/es/logstash-5.6.4/modules/netflow/configuration"}
Configuration OK
[2017-12-12T23:19:14,589][INFO ][logstash.runner ] Using config.test_and_exit mode. Config Validation Result: OK. Exiting Logstashbin/logstash -f config/my.conf --config.reload.automatichostname node152
echo 192.168.58.152 node152>>/etc/hosts[es@node152 logstash-5.6.4]$ bin/logstash -f config/my.conf --config.reload.automatic
Sending Logstash's logs to /home/es/logstash-5.6.4/logs which is now configured via log4j2.properties
[2017-12-12T23:30:29,513][INFO ][logstash.modules.scaffold] Initializing module {:module_name=>"fb_apache", :directory=>"/home/es/logstash-5.6.4/modules/fb_apache/configuration"}
[2017-12-12T23:30:29,518][INFO ][logstash.modules.scaffold] Initializing module {:module_name=>"netflow", :directory=>"/home/es/logstash-5.6.4/modules/netflow/configuration"}
[2017-12-12T23:30:30,449][INFO ][logstash.pipeline ] Starting pipeline {"id"=>"main", "pipeline.workers"=>1, "pipeline.batch.size"=>125, "pipeline.batch.delay"=>5, "pipeline.max_inflight"=>125}
[2017-12-12T23:30:32,004][INFO ][logstash.inputs.beats ] Beats inputs: Starting input listener {:address=>"0.0.0.0:5043"}
[2017-12-12T23:30:32,188][INFO ][logstash.pipeline ] Pipeline main started
[2017-12-12T23:30:32,282][INFO ][org.logstash.beats.Server] Starting server on port: 5043
[2017-12-12T23:30:32,547][INFO ][logstash.agent ] Successfully started Logstash API endpoint {:port=>9600}{
"@timestamp" => 2017-12-13T06:23:55.631Z,
"offset" => 30602,
"@version" => "1",
"input_type" => "log",
"beat" => {
"name" => "node2",
"hostname" => "node2",
"version" => "5.6.5"
},
"host" => "node2",
"source" => "/var/log/httpd/access_log",
"message" => "192.168.58.1 - - [12/Dec/2017:22:23:52 -0800] "GET /noindex/css/fonts/ExtraBold/OpenSans-ExtraBold.ttf HTTP/1.1" 404 248 "http://192.168.58.149/" "Mozilla/5.0 (compatible; MSIE 10.0; Windows NT 6.1; WOW64; Trident/6.0)"",
"type" => "log",
"tags" => [
[0] "beats_input_codec_plain_applied"
]
}
192.168.58.1 - - [12/Dec/2017:22:23:52 -0800] "GET /noindex/css/fonts/ExtraBold/OpenSans-ExtraBold.ttf HTTP/1.1" 404 248 "http://192.168.58.149/" "Mozilla/5.0 (compatible; MSIE 10.0; Windows NT 6.1; WOW64; Trident/6.0)"",
日志的格式是:
|
nformation |
Field Name |
|
IP Address |
|
|
User ID |
|
|
User Authentication |
|
|
timestamp |
|
|
HTTP Verb |
|
|
Request body |
|
|
HTTP Version |
|
|
HTTP Status Code |
|
|
Bytes served |
|
|
Referrer URL |
|
|
User agent |
|
修改配置:
input {
    beats {
        port => "5044"
    }
}
filter {
    grok {
        match => { "message" => "%{COMBINEDAPACHELOG}"}
    }
}
#输出到控制台
output {
    elasticsearch {
        hosts => [ "192.168.58.147:9200" ]
    }
}查看 147的索引 发现自动创建了一个库logstash-2017.12.13
[es@node1 elasticsearch-5.6.4]$ curl -XPOST '192.168.58.147:9200/_search?pretty'
{
  "took" : 73,
  "timed_out" : false,
  "_shards" : {
    "total" : 11,
    "successful" : 11,
    "skipped" : 0,
    "failed" : 0
  },
  "hits" : {
    "total" : 40,
    "max_score" : 1.0,
    "hits" : [
      {
        "_index" : ".kibana",
        "_type" : "config",
        "_id" : "5.6.4",
        "_score" : 1.0,
        "_source" : {
          "buildNum" : 15571
        }
      },
      {
        "_index" : "logstash-2017.12.13",
        "_type" : "log",
        "_id" : "AWBOlbm3i8-nb11quw2I",
        "_score" : 1.0,
        "_source" : {
          "request" : "/noindex/css/fonts/Regular/OpenSans-Regular.woff",
          "agent" : ""Mozilla/5.0 (compatible; MSIE 10.0; Windows NT 6.1; WOW64; Trident/6.0)"",
          "offset" : 35212,
          "auth" : "-",
          "ident" : "-",
          "input_type" : "log",
          "verb" : "GET",
          "source" : "/var/log/httpd/access_log",
          "message" : "192.168.58.1 - - [12/Dec/2017:22:35:18 -0800] "GET /noindex/css/fonts/Regular/OpenSans-Regular.woff HTTP/1.1" 404 245 "http://192.168.58.149/" "Mozilla/5.0 (compatible; MSIE 10.0; Windows NT 6.1; WOW64; Trident/6.0)"",
          "type" : "log",
          "tags" : [
            "beats_input_codec_plain_applied"
          ],
          "referrer" : ""http://192.168.58.149/"",
          "@timestamp" : "2017-12-13T06:35:20.677Z",
          "response" : "404",
          "bytes" : "245",
          "clientip" : "192.168.58.1",
          "@version" : "1",
          "beat" : {
            "name" : "node2",
            "hostname" : "node2",
            "version" : "5.6.5"
          },
          "host" : "node2",
          "httpversion" : "1.1",
          "timestamp" : "12/Dec/2017:22:35:18 -0800"
        }
      }
3》使用kabana监控日志
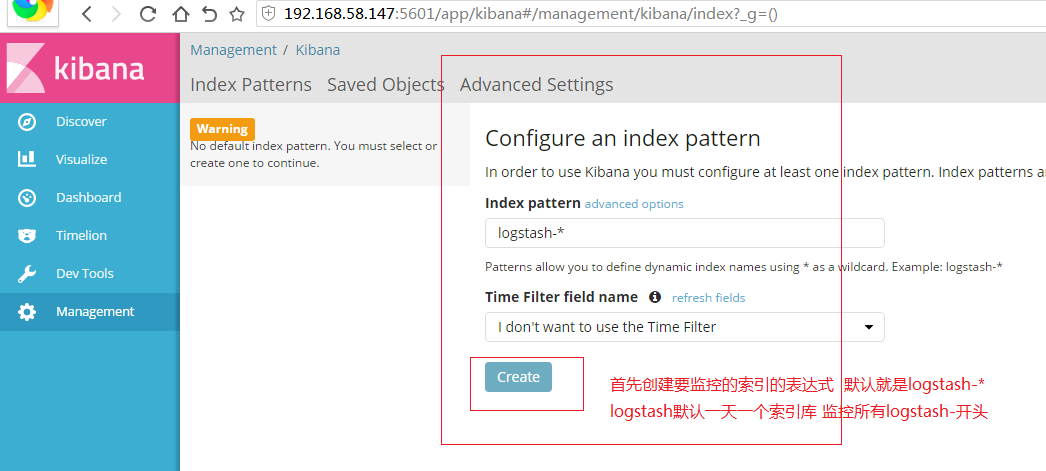
kabana的安装参考之前文档http://blog.csdn.net/liaomin416100569/article/details/78749435
启动kabana 输入网站 http://192.168.58.147:5601
首先创建要监控的索引的表达式 默认就是logstash-*
logstash默认一天一个索引库 监控所有logstash-开头
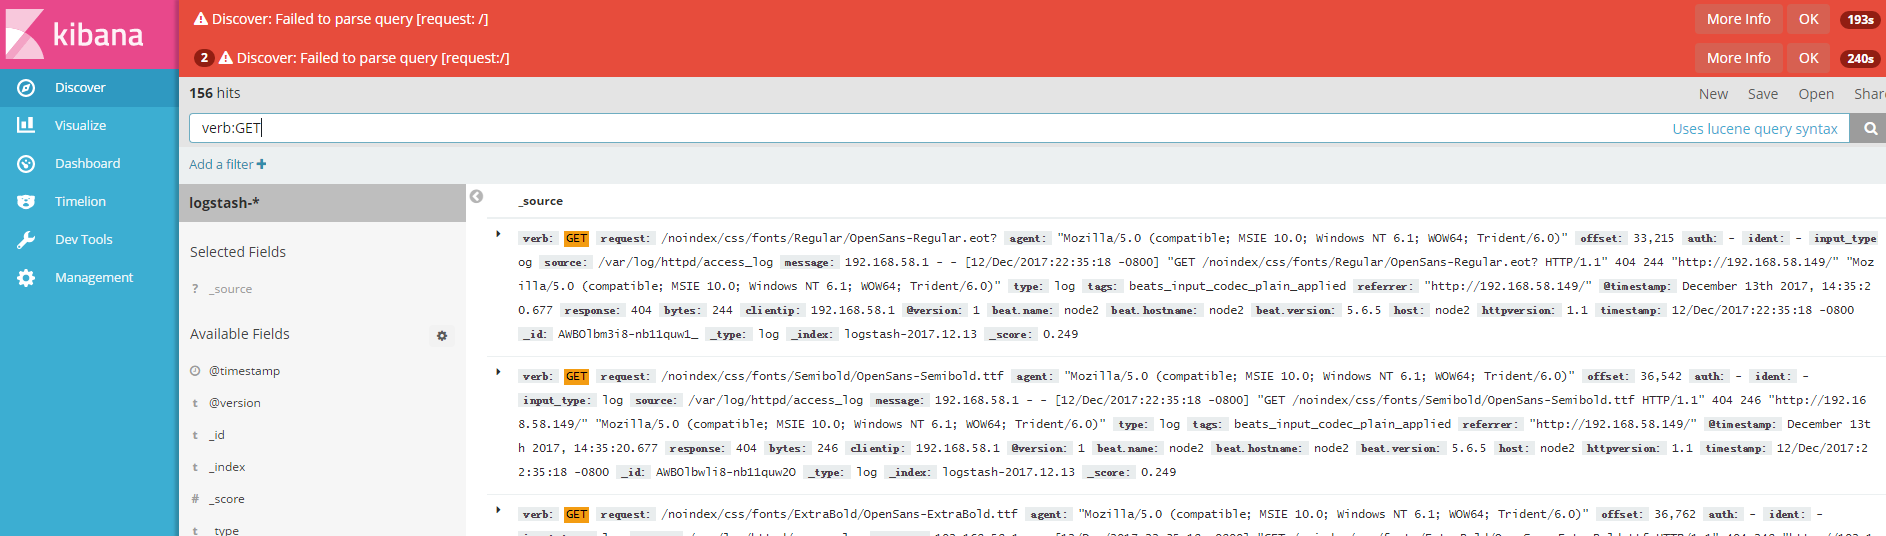
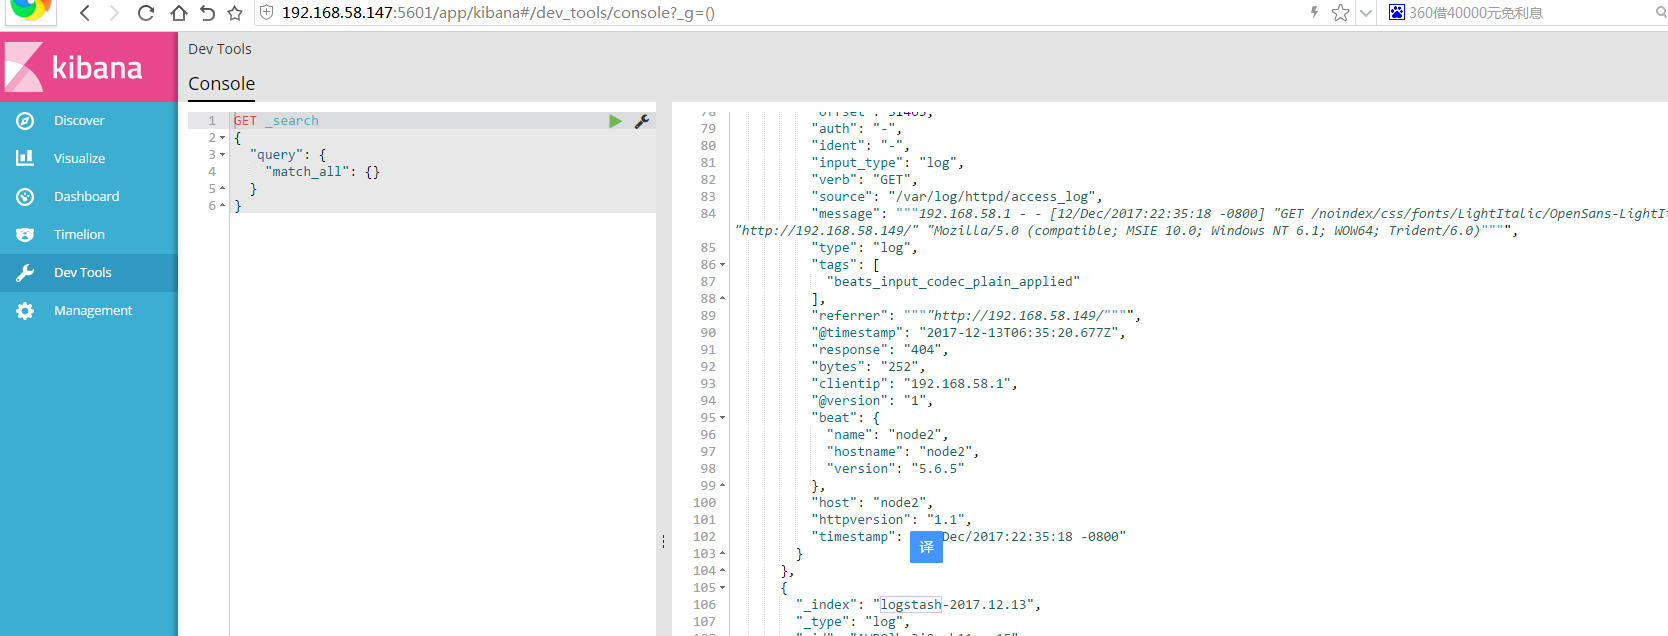
点击创建 点击Dev Tools 使用sense来使用restapi查询索引数据
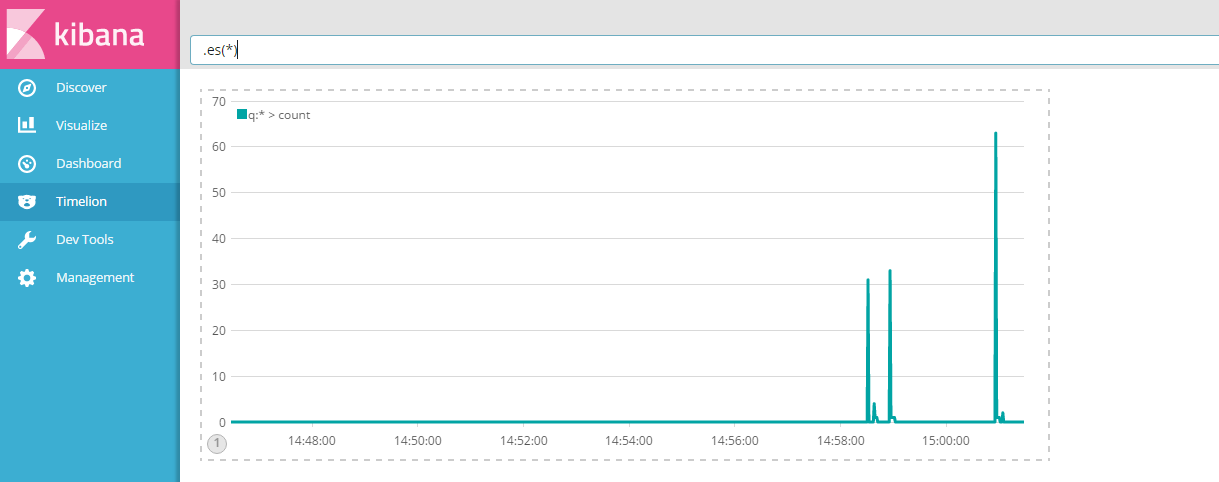
可以使用timeline查看日志的数量图标
可以使用Discover搜索日志 资源名称:值 比如查询所有GET请求 verb:GET