漂亮的图片在一篇报告中是必不可少的。这里推荐一款绘图软件Gnuplot。 Gnuplot是一种免费分发的绘图工具,可以移植到各种主流平台,无论是在Linux还是在Windows都易于安装使用。最新的版本可以到http://www.gnuplot.info/上下载。本文中的例子在Win7系统上gnuplot5.0.5测试可用。这不是细致全能的教程,但是说明了关键位置的处理办法,可以很好地避免学习和使用过程中多走弯路。
1、开始吧
gnuplot是基于命令行的交互式绘图软件。打开一个终端,输入gnuplot,随着程序启动,会出现下面的信息,(如果是在Windows电脑上,双击gnuplot.exe后会自动打开该命令行窗口):

这里包含gnuplot的版本、系统、版权等信息。Terminal type 即使用的方式输出图片。这里默认的terminal是wxt,也就是直接输出到电脑屏幕上。gnuplot支持N多种terminal,没必要都记住。用到哪个现查好了,后续会提到两种。
提示信息之后,是gnuplot的提示符:
gnuplot>
在提示符之后输入各种命令,就可以开始画图了。
如果要退出程序,只需要输入quit或者exit命令。
gnuplot可以下列两种模式之一进行操作:当需要调整和修饰图表使其正常显示时,通过在 gnuplot 提示符中发出命令,可以在交互模式下操作该工具。或者,gnuplot 可以从文件读取命令,以批处理模式生成图表。将拓展名更改为 fileName.plt 就可以将命令保存下来方便重现和更改,因此这也是主要的方式。
2、画一张图
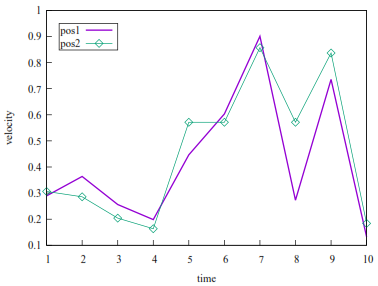
看一个例子。'pic-1.plt'中的代码内容:
set encoding utf8
set terminal pdfcairo enhanced size 4in,3in font "Times New Roman,12"
set output "pic1.pdf"

set tics nomirror
set xtics norangelimit
set key box inside
set key at 2.5, 0.95
set xlabel 'time'
set ylabel 'velocity'

plot "data.txt" using 1:2 with lines ls 1 lw 2 title "pos1",
"" using 1:3 with linespoints ls 2 lw 1 pointtype 12 ps 1 title "pos2",

replot
reset
print "Done!"
'data.txt'中的数据内容:
1 0.2893 0.3061
2 0.3636 0.2857
3 0.2562 0.2041
4 0.1983 0.1633
5 0.4463 0.5714
6 0.6033 0.5714
7 0.9008 0.8571
8 0.2727 0.5714
9 0.7355 0.8367
10 0.1322 0.1837
set是gnuplot中的设置命令,因此我们常常在文尾写上reset来恢复到默认设置,防止对后续生成的图片产生影响。
第1行设置了编码格式,
第2行设置了以PDF的格式输出,设置了图片大小及其中的字体,
第3行设置了输出文件的名称。
第4行设置坐标标记不做镜像处理,其实没有用到。
第5行设置坐标标记不受range的限制。
更多关于绘图环境参数的设置可以参考:http://blog.csdn.net/liyuanbhu/article/details/8502461。
一般绘一图形后,gnuplot将函数名称或图形名称置于右上角。key 参数设定可改变名称放置位置。
第6、7行设置了名称摆放的位置在坐标 x,y 上。
第8、9行设置了坐标轴的标示。
第9行利用数据中的第一列和第二列画线不标出原数据点,ls 1 lw 2 即linestyle 1 linewidth 2,标示的为"pos1"。
第9行利用数据中的第一列和第三列画线标出原数据点的线型,with linespoints ls 2 lw 1 即linestyle 2 linewidth 1,标示的为"pos2"。
这里使用了简写,在点线类型设置时常用的简写还有:
plot sin(x) with line linetype 1 linewidth 2
即plot sin(x) w l lt 1 lw 2
plot sin(x) with point pointtype 2 pointsize 2
或plot sin(x) w p pt 2 ps 2
更多的点线风格可以输入test查看然后进行选择。

最后,只需要load一下就好了。如果读取数据有问题估计是没有变更目录。
gnuplot> cd "d:/..."
gnuplot> load "pic-1.plt"
运行结果:
3、再一张图
除了pdf格式的图片,我们有时还需要emf格式的矢量图方便在MS Office中使用,所以有了例2。
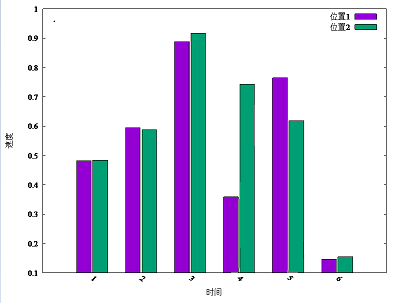
'pic-2.plt'中的代码内容:
# set terminal pngcairo  transparent enhanced font "arial,10" fontscale 1.0 size 600, 400
# set output 'histograms.2.png'
set encoding default
set terminal emf size 800,600 font "Times New Roman,12"
set output "pic2.emf"

set boxwidth 0.9 absolute
set style fill solid 1.00 border lt -1
set key inside right top vertical Right noreverse noenhanced autotitle nobox
set style histogram clustered gap 1 title textcolor lt -1
set minussign
# set datafile missing '-'
set style data histograms
set xtics border in scale 0,0 nomirror rotate by -45  autojustify
set xtics  norangelimit
set xtics  ()

set xlabel '时间'
set ylabel '速度'

plot 'data.txt' using 2:xtic(1) ti col , '' u 3 ti col

reset
print "Done!"
'data.txt'中数据内容:
时间 位置1  位置2
1	0.4824	0.4845
2	0.5941	0.5876
3	0.8882	0.9175
4	0.3588	0.7423
5	0.7647	0.6186
6	0.1471	0.1546
运行结果:
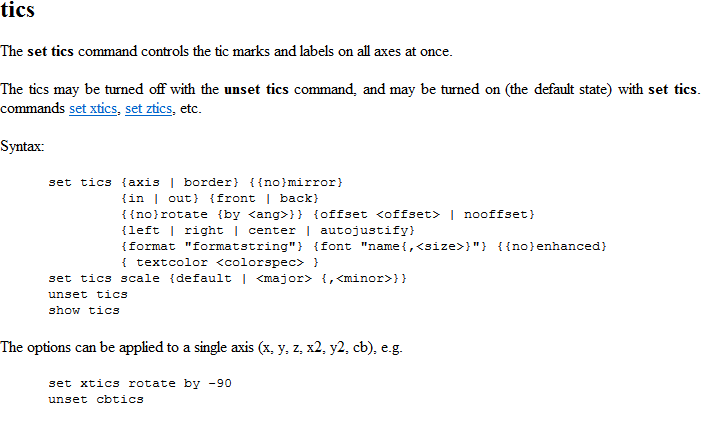
4、寻求帮助
例2是不是有的命令没明白,自带的help完全够。如果遇到本文没有涉及的其他问题基本都可以在这找到答案。
gnuplot>help

例如之前的set tics 等等。
5、拓展
一些基础的问题我会从这里面翻阅,笔记的年份虽早但简明且图文并茂。
http://blog.sciencenet.cn/blog-373392-495870.html
遇到新的问题还是会从官网的demo里面找灵感。
http://gnuplot.sourceforge.net/demo/