Purpose
Reference and mock the course practice, http://dblab.xmu.edu.cn/post/8274/
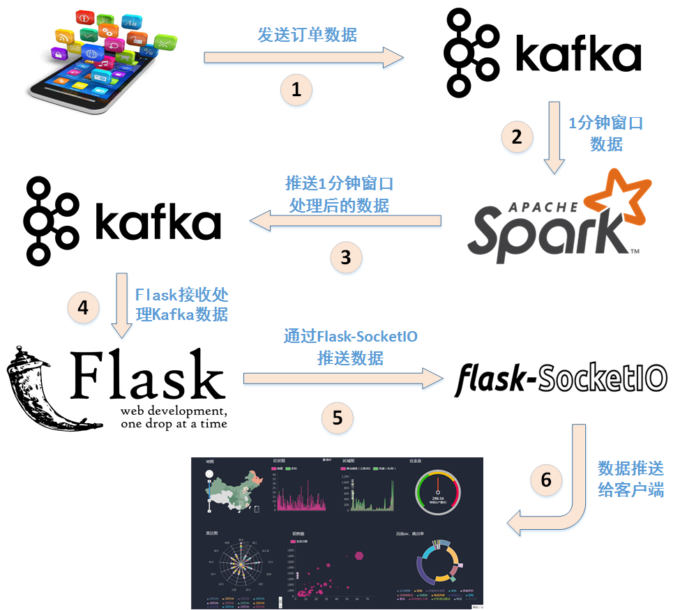
Its business flow is as below picture.
Inspired by this project, and reuse the technologies to implement an feature:
(1) scrawl information from the URL
https://en.wikipedia.org/wiki/COVID-19_pandemic
(2) leverage spark streaming to count words times(words stats).
(3) push word stats to browser to display the imediate info to end user.
Take an exercise for bigdata realtime streaming app for improving competence.
https://github.com/fanqingsong/Realtime-BigData-Dashboard
A demo for realtime dashboard, based on bigdata technology and popular realtime comunication web technology.
Architect
- scrawler.py ---> kafka
- kafka ---> wordCounter.py
- wordCounter.py ---> kafka
- kafka ---> app.py
- app.py ---> browser
Technology
bigdata techs:
- kafka -- tranfer all data between components
- spark streaming -- data statistics
- scrawler -- get raw data from url.
web techs:
- flask -- python web framework
- socket.io -- frontend/backend data exchange tunnel
- vue -- popular frontend JS framework
Install & Run
reference:
https://github.com/fanqingsong/Realtime-BigData-Dashboard
Demo
run srawler app, then go to browser to see the imediate statistics.
python3 backend/scrawler.py