Manifold learning
https://scikit-learn.org/stable/modules/manifold.html#locally-linear-embedding
流形学习是一种非线性降维方法,算法是基于一种想法,很多数据集的高纬度是人为制造的高,并不是真的高。
PCA 等是线性降维方法,这个是非线性方法。应对非线性问题。
Manifold learning is an approach to non-linear dimensionality reduction. Algorithms for this task are based on the idea that the dimensionality of many data sets is only artificially high.
高维数据很难可视化,需要降低为二三维。
最简单的是随机映射,丢掉数据有趣的结构。
PCA ICA LDA等线性降维方法,可以抓取到线性结构,丢掉非线性结构。
流形学习是 PCA 方法的泛化,对数据中的非线性结构更加敏感。
High-dimensional datasets can be very difficult to visualize. While data in two or three dimensions can be plotted to show the inherent structure of the data, equivalent high-dimensional plots are much less intuitive. To aid visualization of the structure of a dataset, the dimension must be reduced in some way.
The simplest way to accomplish this dimensionality reduction is by taking a random projection of the data. Though this allows some degree of visualization of the data structure, the randomness of the choice leaves much to be desired. In a random projection, it is likely that the more interesting structure within the data will be lost.

To address this concern, a number of supervised and unsupervised linear dimensionality reduction frameworks have been designed, such as Principal Component Analysis (PCA), Independent Component Analysis, Linear Discriminant Analysis, and others. These algorithms define specific rubrics to choose an “interesting” linear projection of the data. These methods can be powerful, but often miss important non-linear structure in the data.

Manifold Learning can be thought of as an attempt to generalize linear frameworks like PCA to be sensitive to non-linear structure in data. Though supervised variants exist, the typical manifold learning problem is unsupervised: it learns the high-dimensional structure of the data from the data itself, without the use of predetermined classifications.


什么是流形
https://www.cnblogs.com/jiangxinyang/p/9314256.html
流形学习的观点:认为我们所能观察到的数据实际上是由一个低维流行映射到高维空间的。由于数据内部特征的限制,一些高维中的数据会产生维度上的冗余,实际上这些数据只要比较低的维度就能唯一的表示。所以直观上来讲,一个流形好比是一个d维的空间,在一个m维的空间中(m>d
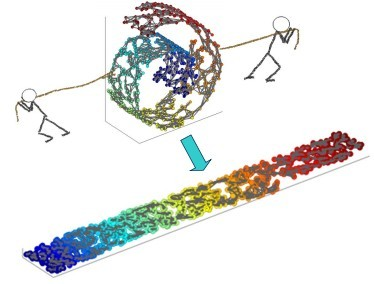
被扭曲之后的结果。需要注意的是流形并不是一个形状,而是一个空间。举个例子来说,比如说一块布,可以把它看成一个二维的平面,这是一个二维的空间,现在我们把它扭一扭(三维空间),它就变成了一个流形,当然不扭的时候,它也是一个流形,欧式空间是流形的一种特殊情况。如下图所示
Swiss Roll reduction with LLE --- 局部线性映射示例
https://scikit-learn.org/stable/auto_examples/manifold/plot_swissroll.html#sphx-glr-auto-examples-manifold-plot-swissroll-py
An illustration of Swiss Roll reduction with locally linear embedding
Out:
Computing LLE embedding
Done. Reconstruction error: 1.26177e-07
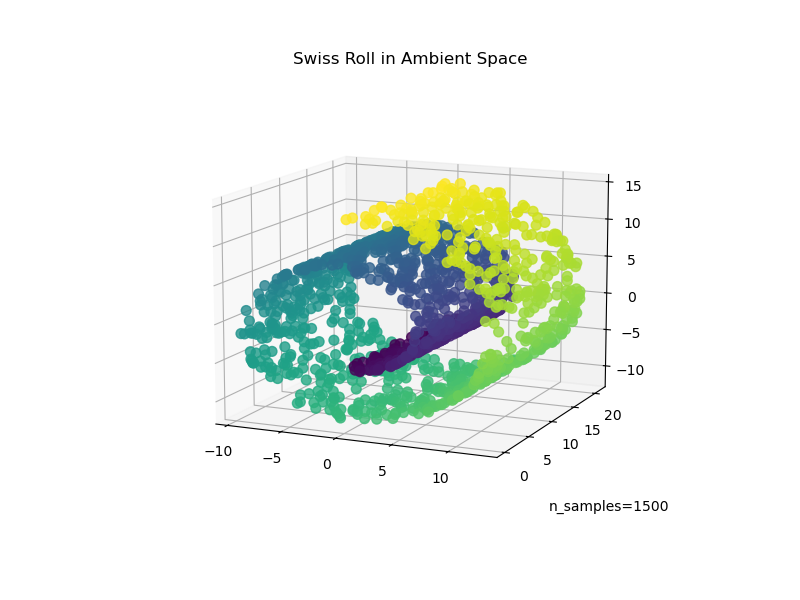
# Author: Fabian Pedregosa -- <fabian.pedregosa@inria.fr>
# License: BSD 3 clause (C) INRIA 2011

print(__doc__)

import matplotlib.pyplot as plt

# This import is needed to modify the way figure behaves
from mpl_toolkits.mplot3d import Axes3D
Axes3D

#----------------------------------------------------------------------
# Locally linear embedding of the swiss roll

from sklearn import manifold, datasets
X, color = datasets.make_swiss_roll(n_samples=1500)

print("Computing LLE embedding")
X_r, err = manifold.locally_linear_embedding(X, n_neighbors=12,
                                             n_components=2)
print("Done. Reconstruction error: %g" % err)

#----------------------------------------------------------------------
# Plot result

fig = plt.figure()

ax = fig.add_subplot(211, projection='3d')
ax.scatter(X[:, 0], X[:, 1], X[:, 2], c=color, cmap=plt.cm.Spectral)

ax.set_title("Original data")
ax = fig.add_subplot(212)
ax.scatter(X_r[:, 0], X_r[:, 1], c=color, cmap=plt.cm.Spectral)
plt.axis('tight')
plt.xticks([]), plt.yticks([])
plt.title('Projected data')
plt.show()
LocallyLinearEmbedding
https://scikit-learn.org/stable/modules/generated/sklearn.manifold.LocallyLinearEmbedding.html#sklearn.manifold.LocallyLinearEmbedding
LLE找到更低维度数据映射,能够保持局部邻居的距离。
可以人为是一系列的局部主成分分析, 但是在全局数据上比对,找出最好的非线性映射。
Locally linear embedding (LLE) seeks a lower-dimensional projection of the data which preserves distances within local neighborhoods.
It can be thought of as a series of local Principal Component Analyses which are globally compared to find the best non-linear embedding.
Locally linear embedding can be performed with function
locally_linear_embeddingor its object-oriented counterpartLocallyLinearEmbedding.

>>> from sklearn.datasets import load_digits
>>> from sklearn.manifold import LocallyLinearEmbedding
>>> X, _ = load_digits(return_X_y=True)
>>> X.shape
(1797, 64)
>>> embedding = LocallyLinearEmbedding(n_components=2)
>>> X_transformed = embedding.fit_transform(X[:100])
>>> X_transformed.shape
(100, 2)