echarts:常用的图表设置
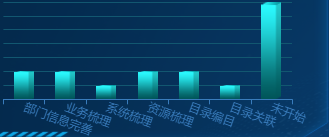
xAxis: [
{
boundaryGap: false,//坐标轴两边是否留白
axisLabel:{
interval:0,//横轴信息全部显示
rotate:-18//-18度角倾斜显示
}
}
],

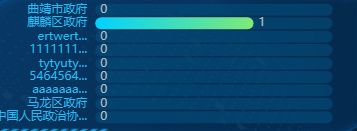
yAxis:[
axisLabel: {
interval:"0",//强制显示所有类目
//坐标文字显示颜色
color: "#26BCF8",
align: "right",
formatter: function (value) {//当x轴类目的文字大于7时...显示
return (value.length >7 ? (value.slice(0,7)+"...") : value );
},
},
],
series: [
{
type: "bar",//背景柱状条
itemStyle: {
normal: {
color: "#035483",
barBorderRadius: 6,
opacity: 0.5
}
},
silent: true,
barWidth: 12,
barGap: "-100%", // Make series be overlap
data: maxdata //背景
},
{
name: '目录数',
type: 'bar',
barWidth: 12,
label: {
normal: {
show: true,
color: "#bcbcbc",
position: "right"
}
},
itemStyle: {
normal: {
color: {
type: "linear",
x: 0,
y: 0,
x2: 1,
y2: 0,
colorStops: [
{
offset: 0,
color: this.echartColor.startcolor // 0% 处的颜色
},
{
offset: 1,
color: this.echartColor.endcolor // 100% 处的颜色
}
],
globalCoord: false // 缺省为 false
},
barBorderRadius: 6
},
emphasis: {
color: {
type: "linear",
x: 0,
y: 0,
x2: 1,
y2: 0,
colorStops: [
{
offset: 0,
color: "#518ff3" // 0% 处的颜色
},
{
offset: 1,
color: "#29d7ff" // 100% 处的颜色
}
],
globalCoord: false // 缺省为 false
},
barBorderRadius: 6
}
},
z: 10,
data: xdata
}
]