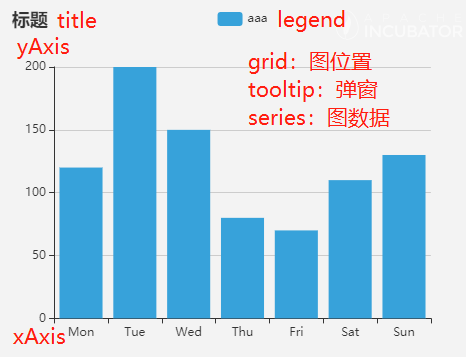
zoukankan      html  css  js  c++  java
  • echarts-3D地图

    一、echarts常用属性

    二、3D地图

      1、安装

    npm i -S echarts@4.9.0 echarts-gl//echarts5会报错

      2、编码

         a、geojson

    {
      "type": "FeatureCollection",
      "features": [
        {
          "type": "Feature",
          "geometry": {
            "type": "MultiPolygon",
            "coordinates": [
              [
                [[40,40],[20,45],[45,30],[40,40]]
              ],
              [
                [[20,35],[10,30],[10,10],[30,5],[45,20],[20,35]],
                [[30,20],[20,15],[20,25],[30,20]]
              ]
            ]
          },
          "properties": {
            "name": "区域一"
          }
        }
      ]
    }

        b、vue

    <template>
      <div style="height:100%;background-color: #999999">
        <div id="echartsmap" style="height:100%"></div>
      </div>
    </template>
    
    <script>
      import echarts from 'echarts';
      import 'echarts-gl';
      import geojson from "./geojson.json";
    
      export default {
        name: "a5",
        mounted() {
          this.initmap()
        },
        methods: {
          initmap() {
            let myChart = echarts.init(document.getElementById("echartsmap"))
            echarts.registerMap("geojson", geojson)
    
            let option = {
              tooltip: {},
              series: [
                {
                  type: "map3D",
                  map: "geojson",
                  label: {
                    show: true
                  },
                  itemStyle: {
                    color: [255, 255, 0, 0.5],
                    borderWidth: 1,
                    borderColor: '#333333'
                  },
                  emphasis: {
                    itemStyle: {
                      color: [0, 255, 0, 0.5]
                    }
                  }
                }
              ]
            }
            myChart.setOption(option)
    
            myChart.on('click', function (params) {
              // console.log(params);
              option.series[0].data = [{
                name: params.data.name,
                itemStyle: {
                  color: [0, 255, 0, 0.5]
                }
              }]
              myChart.setOption(option)
            });
          }
        }
      }
    </script>
    
    <style scoped>
    
    </style>
  • 相关阅读:
    MYSQL: MYSQLBINLOG命令查看日志文件
    JAVA MAIL 发送邮件(SSL加密方式,TSL加密方式)
    Spring和Email整合详解
    java 版百度网盘功能
    Spring @Conditional注解 详细讲解及示例
    spring注解之@Import注解的三种使用方式(转载)
    Redis protected-mode属性解读
    5
    4
    3
  • 原文地址:https://www.cnblogs.com/linding/p/14143632.html
Copyright © 2011-2022 走看看