一、绘图
1)快速生成图


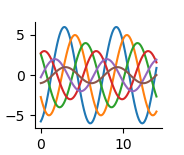
import numpy as np
import matplotlib.pyplot as plt

def sinplot(filp=1):
    x = np.linspace(0,14,100)
    for i in range(1,7):
        plt.plot(x,np.sin(x + i * 5) * (7 - i) * filp)
sinplot()
plt.show()

特别注意: 在ipython中,在导入模块前引用 %matplotlib inline 可替代plt.show()
           在pycharm中不支持 %matplotlib inline 。所有只能 plt.show()  来展示图
sns.set() 默认风格
2)去掉上面,和右边的多余的线。sns.despine()
import seaborn as sns
import numpy as np
import matplotlib.pyplot as plt

def sinplot(filp=1):
    x = np.linspace(0,14,100)
    for i in range(1,7):
        plt.plot(x,np.sin(x + i * 5) * (7 - i) * filp)
sinplot()
sns.despine()
plt.show()
3)风格的展示。调试的是背景
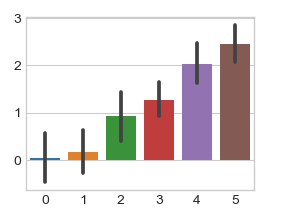
sns.set_style('whitegrid')
5种主题风格
darkgrid
whitegrid
dark
white
ticks
示例一:sns.set_style('whitegrid')
import seaborn as sns
import numpy as np
import matplotlib.pyplot as plt
sns.set_style('whitegrid')
data = np.random.normal(size=(20,6)) + np.arange(6) / 2
sns.barplot(data=data)
plt.show()
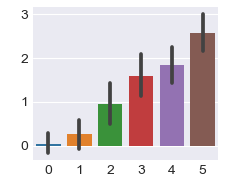
示例二:sns.set_style('darkgrid')
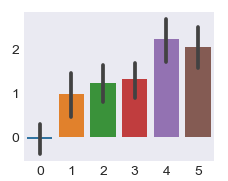
示例三:sns.barplot(data=data)
4)可以设置离轴线的距离。sns.despine(offset=10)
import seaborn as sns
import numpy as np
import matplotlib.pyplot as plt
sns.set_style('whitegrid')

data = np.random.normal(size=(20,6)) + np.arange(6) / 2
sns.violinplot(data)
sns.despine(offset=10)  # 离轴线的距离
plt.show()
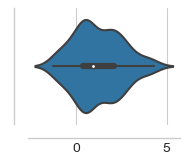
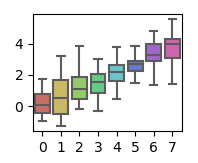
5)隐藏左边的轴线。sns.despine(left=True)
import seaborn as sns
import numpy as np
import matplotlib.pyplot as plt

data = np.random.normal(size=(20,6)) + np.arange(6) / 2
sns.set_style('whitegrid')
sns.boxplot(data=data,palette='deep')
sns.despine(left=True)
plt.show()

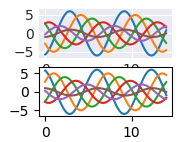
6)指定多种风格。with里面,with外面
import seaborn as sns
import numpy as np
import matplotlib.pyplot as plt

with sns.axes_style("darkgrid"):    # with里面指定一个风格
    plt.subplot(211)
    sinplot()
plt.subplot(212)    # 外面指定别的风格
sinplot(-1)
plt.show()
7、了解。设置线粗细,坐标文件大小等
import seaborn as sns
import numpy as np
import matplotlib.pyplot as plt

sns.set()
sns.set_context("paper")  # 绘制图的大小 :sns.set_context("talk"),poster,notebook
# sns.set_context("paper",font_scale=1.5,rc={"lines.linewidth":2.5})
#  font_scale=1.5,坐标文字的大小。rc={"lines.linewidth":2.5} 线的粗细
plt.figure(figsize=(8,6))
sinplot()
plt.show()
二、调色板
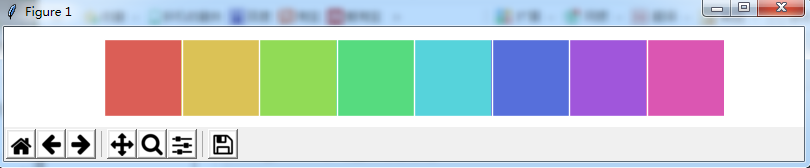
1)快速生成调色板
调色板
color_palette() 能传入任何Matplotlib所支持的颜色
color_palette() 不写参数则默认颜色
set_palette() 设置所有图的颜色
示例
import seaborn as sns
import matplotlib.pyplot as plt
sns.set(rc = {"figure.figsize":(6,6)})
current_palette = sns.color_palette()
sns.palplot(current_palette)
plt.show()

6个默认的颜色循环主题:deep,muted,pastel,bright,dark,colorblind
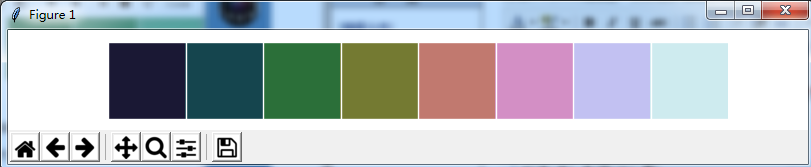
2)当需要更多颜色主题的时候,调用画板。sns.color_palette("hls",8)
import seaborn as sns
import matplotlib.pyplot as plt
sns.set(rc = {"figure.figsize":(6,6)})
current_palette = sns.color_palette("hls",8)
sns.palplot(current_palette)
plt.show()
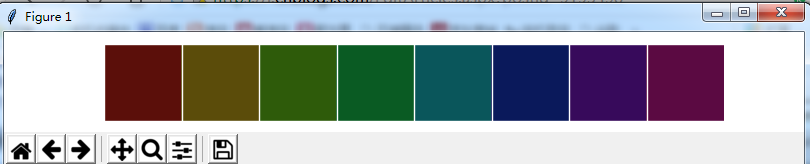
3)设置颜色的饱和度和亮度。sns.hls_palette(8,l=.2,s =.8)
import seaborn as sns
import matplotlib.pyplot as plt
sns.set(rc = {"figure.figsize":(6,6)})
sns.palplot(sns.hls_palette(8,l=.2,s =.8))  # 注意,前面有小点。饱和度 l=.2,亮度 s =.8
plt.show()
l ==》亮度 lightness
s ==》饱和 saturation
4)相近颜色的对比色。sns.color_palette("Paired",8)
import seaborn as sns
import matplotlib.pyplot as plt
sns.set(rc = {"figure.figsize":(6,6)})
sns.palplot(sns.color_palette("Paired",8))     # 相近颜色的对比色。sns.color_palette("Paired",8)
plt.show()

5)将颜色传入绘制的图形中
import numpy as np
import seaborn as sns
import matplotlib.pyplot as plt
data = np.random.normal(size=(20,8)) + np.arange(8) / 2
sns.boxplot(data=data,palette=sns.color_palette("hls",8))
plt.show()
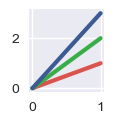
6)使用xkcd颜色来命令颜色
import seaborn as sns
import matplotlib.pyplot as plt
sns.set(rc = {"figure.figsize":(6,6)})
plt.plot([0,1],[0,1], sns.xkcd_rgb["pale red"], lw=3)
plt.plot([0,1],[0,2], sns.xkcd_rgb["medium green"], lw=3)
plt.plot([0,1],[0,3], sns.xkcd_rgb["denim blue"], lw=3)
plt.show()
plt.close()
xkcd包含了一套众包努力的针对随机RGB色的命名。产生了954个可以随时通过xkcd_rgb字典中的命令颜色
7)列表传值绘制多种颜色
import seaborn as sns
import matplotlib.pyplot as plt
sns.set(rc = {"figure.figsize":(6,6)})
colors = ["windows blue",'amber',"greyish","faded green","dusty purple"]
sns.palplot(sns.xkcd_palette(colors))
plt.show()
plt.close()

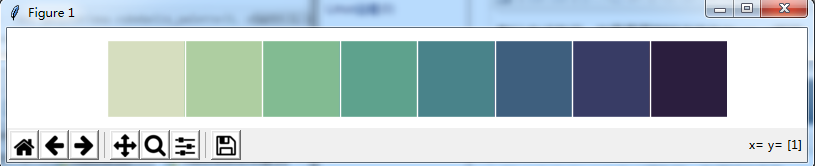
8)连续渐变色画板。sns.palplot(sns.color_palette("Blues"))
import seaborn as sns
import matplotlib.pyplot as plt
sns.set(rc = {"figure.figsize":(6,6)})
sns.palplot(sns.color_palette("Blues"))
plt.show()
plt.close()
默认由浅变深。如果需要翻转渐变色Blues_r 即可

9)cubehelix_palette()调色板。色调线性变换。sns.color_palette("cubehelix",8)
import seaborn as sns
import matplotlib.pyplot as plt
sns.set(rc = {"figure.figsize":(6,6)})
sns.palplot(sns.color_palette("cubehelix",8))
plt.show()
plt.close()
10)在这个区间颜色的变化。sns.cubehelix_palette(8,start=.5,rot=-.75)
import seaborn as sns
import matplotlib.pyplot as plt
sns.set(rc = {"figure.figsize":(6,6)})
sns.palplot(sns.cubehelix_palette(8,start=.5,rot=-.75))     # 在这个区间颜色的变化
plt.show()
plt.close()
11)定制连续的调色板
示例:sns.light_palette("green")
import seaborn as sns
import matplotlib.pyplot as plt
sns.set(rc = {"figure.figsize":(6,6)})
sns.palplot(sns.light_palette("green"))     # 定制连续的调色板
plt.show()
plt.close()

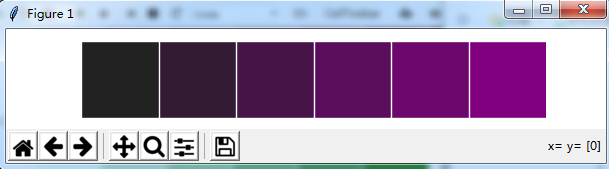
示例:sns.dark_palette("purple")
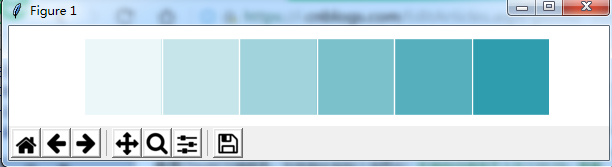
示例: sns.light_palette("navy",reverse=True)

示例:渐变色的另一种方法。sns.light_palette((210,90,60),input="husl")
import seaborn as sns
import matplotlib.pyplot as plt
sns.set(rc = {"figure.figsize":(6,6)})
sns.palplot(sns.light_palette((210,90,60),input="husl"))     # 定制连续的调色板
plt.show()
plt.close()
12)利用渐变色绘制海拔
import numpy as np
import seaborn as sns
import matplotlib.pyplot as plt
sns.set(rc = {"figure.figsize":(6,6)})
x,y = np.random.multivariate_normal([0,0],[[1,-.5],[-.5,1]],size=300).T
print(x)
print(y)
pal = sns.dark_palette("green",as_cmap=True)
sns.kdeplot(x,y,cmap=pal)
plt.show()
plt.close()
