前言:本文爬虫的关键字眼是“美食”,实际分析时发现“零食”的销售量远远高于“美食”,因此在一开始的数据层面就已经决定了本文分析的片面性,本篇博客主要是用于记录代码和分析过程。
实际的结论请看下一篇博客(下一篇博客爬虫的关键字眼是“零食”)。
https://www.cnblogs.com/little-monkey/p/10822369.html
一、爬虫
根据崔庆才老师的爬虫视频修改而来,利用selenium进行淘宝爬取(本来想用火车采集器爬取的,尝试了一下发现没法截取淘宝网址的字段)。
selenium完全模拟人工点击操作,原理上可以爬取淘宝的所有可见内容。
爬虫代码有参考 https://www.cnblogs.com/hustcser/p/8744355.html
import re
import time
from selenium import webdriver
from selenium.common.exceptions import TimeoutException
from selenium.webdriver.common.by import By
from selenium.webdriver.support.ui import WebDriverWait
from selenium.webdriver.support import expected_conditions as EC
from pyquery import PyQuery as pq
import pymongo

MONGO_URL = 'localhost'
MONGO_DB = 'taobao'
MONGO_TABLE = 'product2'
KEYWORD = '美食'
PAGE_NUM=35            #爬取页数

client=pymongo.MongoClient(MONGO_URL)
db=client[MONGO_DB]

browser = webdriver.Chrome()
wait=WebDriverWait(browser, 10)

def search():
    print('正在搜素...')
    try:
        browser.get('https://s.taobao.com/search?q=%E7%BE%8E%E9%A3%9F&imgfile=&commend=all&ssid=s5-e&search_type=item&sourceId=tb.index&spm=a21bo.2017.201856-taobao-item.1&ie=utf8&initiative_id=tbindexz_20170306&sort=sale-desc&bcoffset=-30&p4ppushleft=%2C44&ntoffset=-30&fs=1&filter_tianmao=tmall&s=0')
        page_num=PAGE_NUM
        get_products()      # 获取页面详情
        return page_num
    except TimeoutException:
        return search()

# 获取下页
def next_page(page_number):
    print('正在翻页%s', page_number)
    time.sleep(3)
    try:
        input = wait.until(EC.presence_of_element_located((By.CSS_SELECTOR, "#mainsrp-pager > div > div > div > div.form > input")))
        submit = wait.until(EC.element_to_be_clickable((By.CSS_SELECTOR, '#mainsrp-pager > div > div > div > div.form > span.btn.J_Submit')))
        input.clear()
        input.send_keys(page_number)
        submit.click()
        wait.until(EC.text_to_be_present_in_element((By.CSS_SELECTOR,'#mainsrp-pager > div > div > div > ul > li.item.active > span'),str(page_number)))
        get_products()
    except TimeoutException:
        next_page(page_number)

# 解析页面
def get_products():
    # 判断元素是否已经加载下来
    wait.until(EC.presence_of_element_located((By.CSS_SELECTOR, '#mainsrp-itemlist .items .item')))
    html=browser.page_source
    doc=pq(html)
    items=doc("#mainsrp-itemlist .items .item").items()
    for item in items:
        product={
            # 'image': item.find('.pic .img').attr('src'),
            'title': item.find('.title').text(),
            'price': item.find('.price').text(),
            'deal': item.find('.deal-cnt').text()[:-3],
            'location': item.find('.location').text(),
            'shop': item.find('.shop').text()
        }
        print(product)
        save_to_mongo(product)

def save_to_mongo(result):
    try:
        if db[MONGO_TABLE].insert(result):
            print('存储到MongoDB成功',result)
    except Exception:
        print('存储到MongoDB失败',result)

def main():
    try:
        page_num=search()
        for i in range(2,page_num+1):
            next_page(i)
    except Exception:
        print('出错啦')
    finally:
        browser.close()

if __name__ == '__main__':
    main()
注意:运行程序后会弹出淘宝登陆页面,使用手机淘宝扫描登陆,然后坐等爬取结果,最后从MongoDB中导出CSV文件即可。
结果如下:
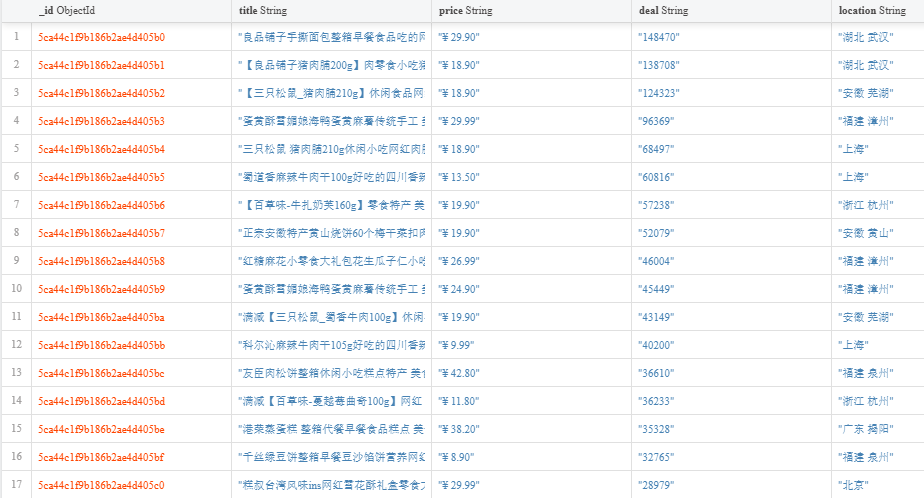
二、数据处理
data= pd.read_csv('data/淘宝美食35页.csv', encoding='utf8',engine='python')
data.drop('_id',axis=1, inplace=True)                #去掉id列
data['price'].replace('¥', '', regex=True, inplace=True)     #去掉price列的'¥'

#从location列中取出省份和城市,然后删除location列
data['province']=data.location.apply(lambda x:x.split()[0])
data['city']=data.location.apply(lambda x:x.split()[0] if len(x)<4 else x.split()[1])
data.drop('location',axis=1, inplace=True)

#数据类型转化
data['price']=data.price.astype('float64')
for i in ['province','city']:
    data[i]=data[i].astype('category')
运行结果如下:

三、数据挖掘与分析
【数据处理】
import jieba

#导入整理好的待添加词语(因为jieba本身的分词功能不足以应付特定数据)
add_words = pd.read_excel('data/add_words.xlsx',header=None)
add_words_list = add_words[0].tolist()
for w in add_words_list:                    # 添加词语
   jieba.add_word(w , freq=1000)

#导入停用词表
stopwords = [line.strip() for line in open('data/stop.csv', 'r', encoding='utf-8').readlines()]

#对每个标题进行分词,使用lcut函数
title=data.title.values.tolist()     #转为list
title_s=[]
for line in title:
    title_cut=jieba.lcut(line)
    title_s.append(title_cut)

#去除冗余词Plan1:剔除停用词:
title_clean = []
for line in title_s:
   line_clean = []
   for word in line:
      if word not in stopwords:
         line_clean.append(word)
   title_clean.append(line_clean)
#去除冗余词Plan2:直接定义,定义完后再调用lcut函数
#removes =['熟悉', '技术', '职位', '相关', '工作', '开发', '使用','能力','优先','描述','任职']
#for w in removes:
#   jieba.del_word(w)

#去重,对title_clean中的每个list的元素进行去重,即每个标题被分割后的词语唯一,如【麻辣小鱼干香辣小鱼干】->【麻辣,香辣,小鱼干】
#去重后的title_clean_dist为二维list,即[[……],[……],……]
title_clean_dist = []
for line in title_clean:
   line_dist = []
   for word in line:
      if word not in line_dist:
         line_dist.append(word)
   title_clean_dist.append(line_dist)

# 将 title_clean_dist 转化为一维list
allwords_clean_dist = []
for line in title_clean_dist:
   for word in line:
      allwords_clean_dist.append(word)

# 把列表 allwords_clean_dist 转为数据框:
df_allwords_clean_dist = pd.DataFrame({'allwords': allwords_clean_dist})

# 对过滤_去重的词语 进行分类汇总:
word_count = df_allwords_clean_dist.allwords.value_counts().reset_index()
word_count.columns = ['word','count']      #添加列名
【词云可视化】
# 词云可视化
from PIL import Image
from wordcloud import WordCloud
import matplotlib.pyplot as plt

txt = " ".join(allwords_clean_dist)                #将list转成str,便于词云可视化
food_mask=np.array(Image.open("data/mask.png"))
wc = WordCloud(font_path='data/simhei.ttf',        # 设置字体
               background_color="white",           # 背景颜色
               max_words=1000,                    # 词云显示的最大词数
               max_font_size=100,                  # 字体最大值
               min_font_size=5,                   #字体最小值
               random_state=42,                   #随机数
               collocations=False,                 #避免重复单词
               mask=food_mask,                     #造型遮盖
               width=1000,height=800,margin=2,     #图像宽高,字间距,需要配合下面的plt.figure(dpi=xx)放缩才有效
              )
wc.generate(txt)

plt.figure(dpi=200)
plt.imshow(wc, interpolation='catrom',vmax=1000)
plt.axis("off")                                 #隐藏坐标

plt.rcParams['figure.dpi'] = 600
plt.savefig('E:\1标题词云.png')

进一步的,进行不同关键词销量的可视化
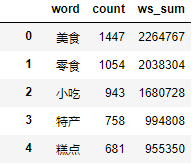
【销量统计】
ws_sum=[]
for w in word_count.word:
    i=0
    s_list=[]
    for t in title_clean_dist:
        if w in t:
            s_list.append(data.deal[i])
        i+=1
    ws_sum.append(sum(s_list))

df_sum=pd.DataFrame({'ws_sum':ws_sum})
df_word_sum=pd.concat([word_count,df_sum],axis=1,ignore_index=True)
df_word_sum.columns=['word','count','ws_sum']    #词语,出现次数,包含该词语的商品销量

df_word_sum.drop(8,axis=0,inplace=True)            #删除“空格”词所在的8行
df_word_sum.sort_values('ws_sum',inplace=True,ascending=True)    #升序排列
df_ws=df_word_sum.tail(40)

index=np.arange(df_ws.word.size)
plt.figure(figsize=(16,13))
plt.barh(index,df_ws.ws_sum,align='center')
plt.yticks(index,df_ws.word,fontsize=11)

#添加数据标签
for y,x in zip(index,df_ws.ws_sum):
    plt.text(x,y,'%.0f' %x,ha='left',va='center',fontsize=11)    #ha参数有【center,left,right】,va参数有【top,bottom,center,baseline】

plt.savefig('E:\2销量词汇排行.png')
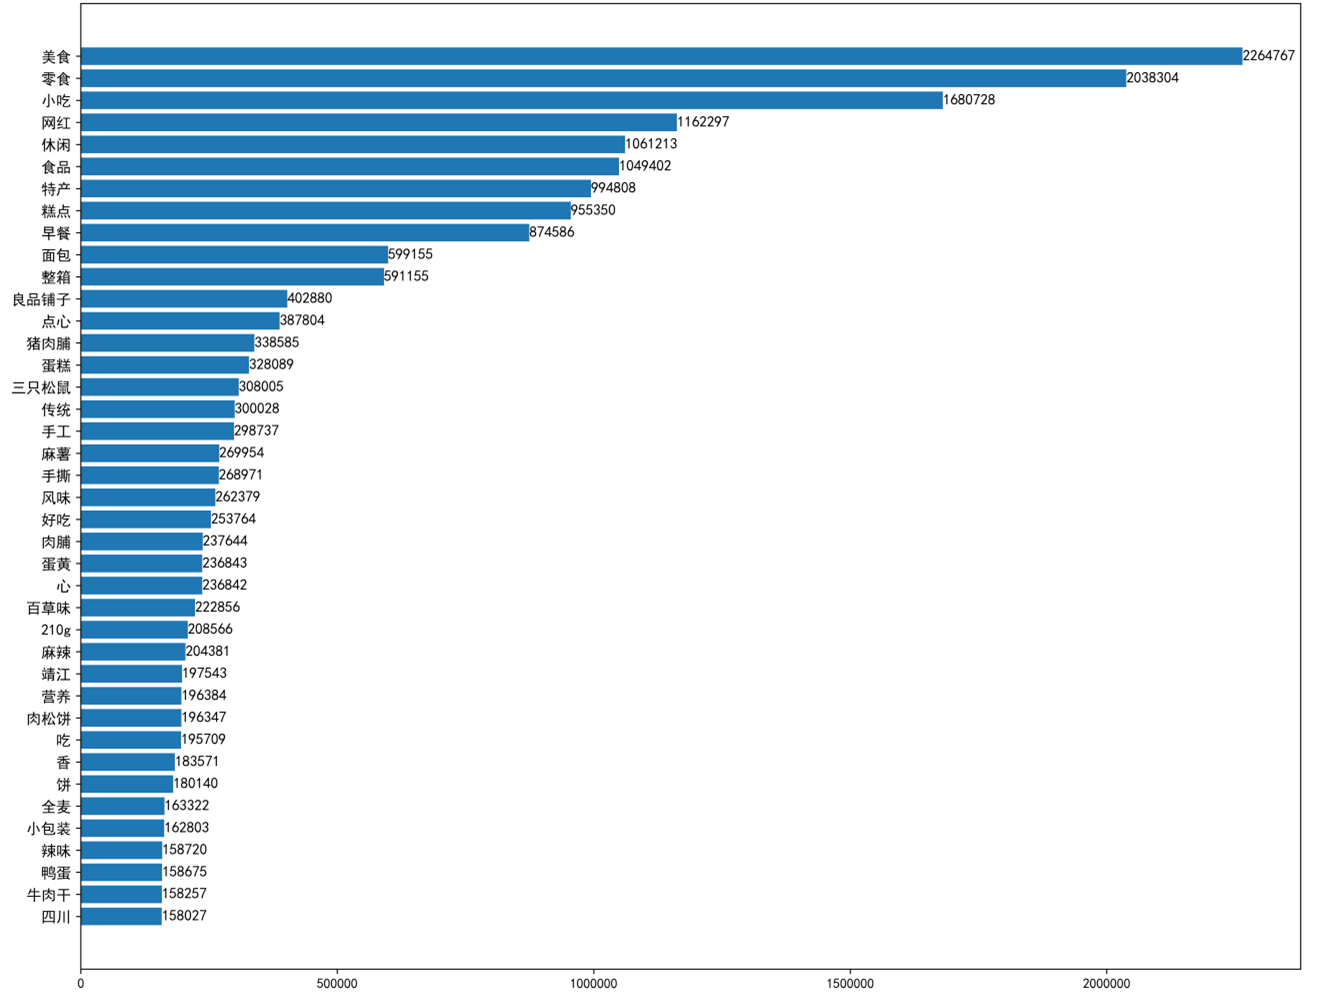
【分析1】根据淘宝标题(卖家倾向)+销量(买家倾向)分析市场情况
1、美食、零食、小吃等字眼的商品占比较高;
2、从进餐时间来看,早餐卖的最多,下午茶也有一定空间;
3、从地域来看,川渝美食领跑全国,湖南、云南、北京、厦门次之,南京、安徽、上海、黄山也有一定市场;
4、从种类来看,糕点>面包>肉脯>蛋类,看来中国人民喜欢甜点多于肉、蛋制品;
5、从风格来看,特产和网红处于第一梯队,特产卖家最多,网红销量最高,第二梯队中传统>营养,国人钟爱特产以及网红美食坐上销量宝座的深层原因,可能是宣传,即买家购买零食时更倾向于购买听说过的东西;
6、从包装来看,整箱包装最受欢迎,小包装次之,大礼包、散装、礼盒、批发虽然常见于卖家,但销量比不上整箱包装和小包装,这也和糕点、面包类畅销相关;
7、从口味来看,麻辣和香辣最受欢迎,和川渝美食地位相符;
8、从品牌来看,销量上 良品铺子>三只松鼠>百草味,三巨头领衔零食市场,已初步形成口碑。
【总结1】对美食而言,有力的宣传可以极大促进销量。川渝美食领跑全国,既和其口味【麻辣】、【香辣】有关,更和其“小吃”、“美女”、“网红”等城市标签有关;糕点、面包等精致食品广受【办公室人群】的欢迎。
同理,进行【店名分析】
#导入整理好的待添加词语(因为jieba本身的分词功能不足以应付特定数据)
add_words = pd.read_excel('data/add_words.xlsx',header=None)
add_words_list = add_words[0].tolist()
for w in add_words_list:                    # 添加词语
   jieba.add_word(w , freq=1000)

#去除冗余词:直接定义,定义完后再调用lcut函数
removes =['来', '和', '有']
for w in removes:
   jieba.del_word(w)

#对每个标题进行分词,使用lcut函数
shop=data.shop.values.tolist()     #转为list
shop_s=[]
for line in shop:
    shop_cut=jieba.lcut(line)
    shop_s.append(shop_cut)

shop_clean_dist = []
for line in shop_s:
   line_dist = []
   for word in line:
      if word not in line_dist:
         line_dist.append(word)
   shop_clean_dist.append(line_dist)

# 将 title_clean_dist 转化为一维list
shop_list = []
for line in shop_clean_dist:
   for word in line:
      shop_list.append(word)

txt = " ".join(shop_list)                #将list转成str,便于词云可视化
sh = WordCloud(font_path='data/simhei.ttf',     # 设置字体
               background_color="white",          # 背景颜色
               max_words=100,                  # 词云显示的最大词数
               max_font_size=100,                  # 字体最大值
               min_font_size=5,                 #字体最小值
               random_state=42,                 #随机数
               collocations=False,                 #避免重复单词
               width=600,height=400,margin=2,     #图像宽高,字间距,需要配合下面的plt.figure(dpi=xx)放缩才有效
              )
sh.generate(txt)
plt.figure(dpi=200)
plt.imshow(sh, interpolation='catrom',vmax=1000)
plt.axis("off")

# 把列表 allwords_clean_dist 转为数据框:
shop_list = pd.DataFrame({'allwords': shop_list})

# 对过滤_去重的词语 进行分类汇总:
shop_count = shop_list.allwords.value_counts().reset_index()
shop_count.columns = ['shop','count']      #添加列名

#销量统计
sh_sum=[]
for w in shop_count.shop:
    i=0
    s_list=[]
    for t in shop_clean_dist:
        if w in t:
            s_list.append(data.deal[i])
        i+=1
    sh_sum.append(sum(s_list))

df_sum=pd.DataFrame({'sh_sum':sh_sum})
df_word_sum=pd.concat([shop_count,df_sum],axis=1,ignore_index=True)
df_word_sum.columns=['shop','count','shop_sum']    #店名,出现次数,该店总销量

df_word_sum.sort_values('shop_sum',inplace=True,ascending=True)    #升序排列
df_sh=df_word_sum.tail(30)

index=np.arange(df_sh.shop.size)
plt.figure(figsize=(12,9))
plt.barh(index,df_sh.shop_sum,align='center')
plt.yticks(index,df_sh.shop,fontsize=11)
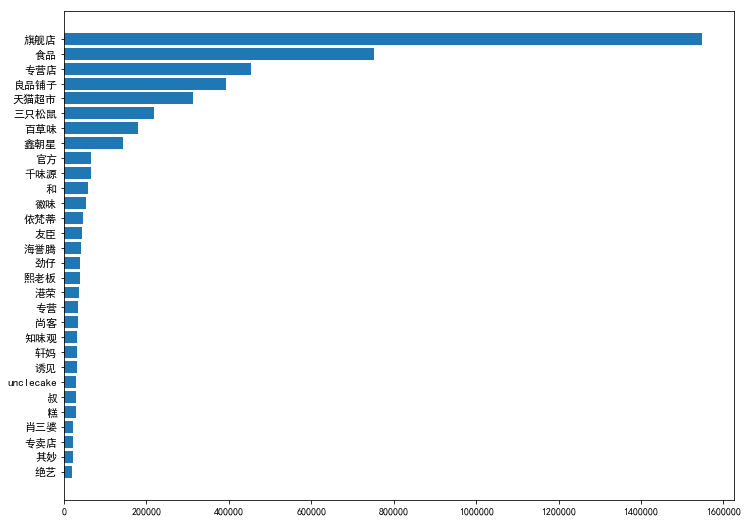
【分析2】店名分析
1、多数店名带有“旗舰店”、“食品”、“专营”等字眼;
2、良品铺子霸居榜首,虽然其商品数量不多(只有14件),但其销量高,甚至胜于天猫超市;
【总结2】店名最好带有“旗舰店”,对卖家有信服力
【价格分布】
data_p=data[data['price']<150]
print('价格在150以下的商品占比:%.3f'%(len(data_p)/len(data)))

plt.figure(figsize=(7,5))
plt.hist(data_p['price'],bins=25)
plt.xlabel('价格',fontsize=12)
plt.ylabel('商品数量',fontsize=12)
plt.title('不同价格对应的商品数量分布',fontsize=12)
价格在150以下的商品占比:0.990

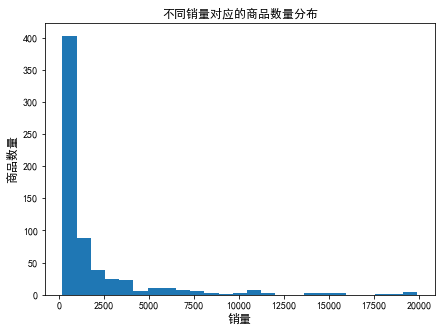
data_s=data[data['deal']<20000]
data_s=data_s[data_s['deal']>200]
print('销量在200~20000之间的商品占比:%.3f'%(len(data_s)/len(data)))

plt.figure(figsize=(7,5))
plt.hist(data_s['deal'],bins=25)
plt.xlabel('销量',fontsize=12)
plt.ylabel('商品数量',fontsize=12)
plt.title('不同销量对应的商品数量分布',fontsize=12)
销量在200~20000之间的商品占比:0.419
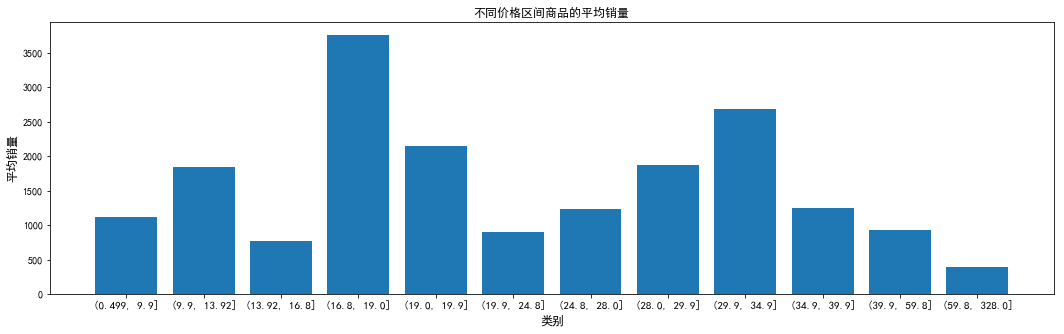
#用qcut将price分成12组
data['group']=pd.qcut(data.price,12)
df_group=data.group.value_counts().reset_index()

#以group列进行分类,求deal销量的均值
df_sg=data[['deal','group']].groupby('group').mean().reset_index()

#绘柱形图
index=np.arange(df_sg.group.size)
plt.figure(figsize=(18,5))
plt.bar(index,df_sg.deal)
plt.xticks(index,df_sg.group,fontsize=11)
plt.xlabel('类别',fontsize=12)
plt.ylabel('平均销量',fontsize=12)
plt.title('不同价格区间商品的平均销量',fontsize=12)
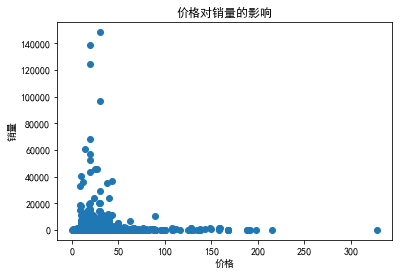
fig,ax=plt.subplots()
ax.scatter(data['price'],data['deal'])
ax.set_xlabel('价格')
ax.set_ylabel('销量')
ax.set_title('价格对销量的影响')
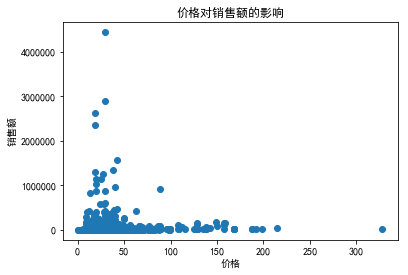
data['GMV']=data['price']*data['deal']

fig,ax=plt.subplots()
ax.scatter(data['price'],data['GMV'])
ax.set_xlabel('价格')
ax.set_ylabel('销售额')
ax.set_title('价格对销售额的影响')
【分析3】根据价格、销量、销售额分析定价影响
1、定价在25元左右的商品最多;
2、销量越高,商品越少,形成“长尾”分布;
3、【16.8,19】价格区间的销量最高,【29.9,34.9】销量次高峰;
4、价格在15~45之间的销量和销售额都不错,50元以上的零食并不畅销。
【总结3】对零食市场而言,应走“薄利多销”路线,50元以下的市场份额最大。
【地域分布】
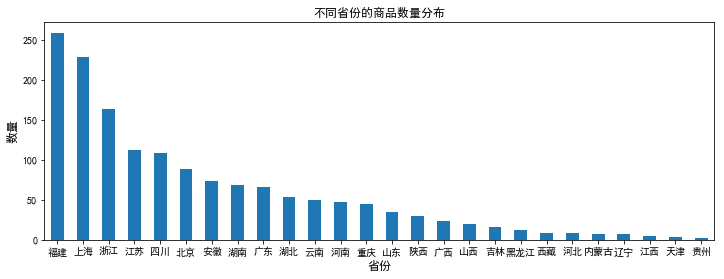
plt.figure(figsize=(12,4))
data.province.value_counts().plot(kind='bar')
plt.xticks(rotation=0)    #让字体横向分布
plt.xlabel('省份',fontsize=12)
plt.ylabel('数量',fontsize=12)
plt.title('不同省份的商品数量分布',fontsize=12)
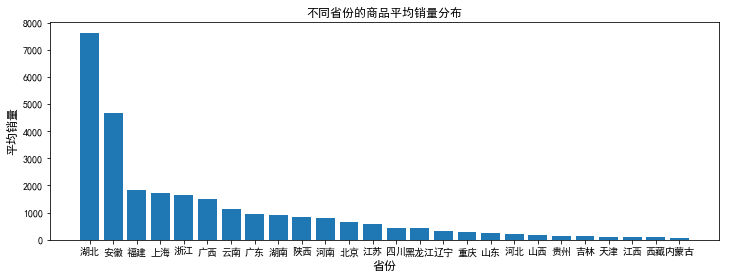
pro_sales=data.pivot_table(index='province',values='deal',aggfunc=np.mean)   #分类求均值
pro_sales.sort_values('deal',inplace=True,ascending=False)
pro_sales=pro_sales.reset_index()

index=np.arange(pro_sales.deal.size)
plt.figure(figsize=(12,4))
plt.bar(index,pro_sales.deal)
plt.xticks(index,pro_sales.province,rotation=0)    #让字体横向分布
plt.xlabel('省份',fontsize=12)
plt.ylabel('平均销量',fontsize=12)
plt.title('不同省份的商品平均销量分布',fontsize=12)

pro_sales.to_excel('data/pro_sales.xlsx',index=False)
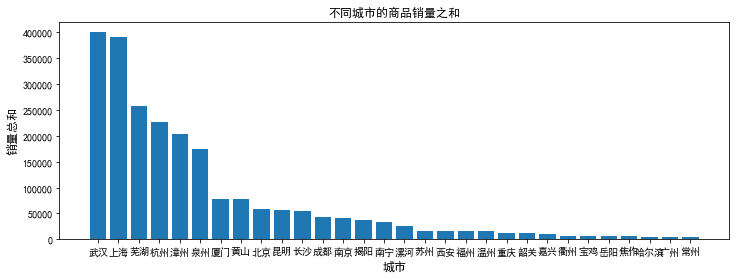
city_sales=data.pivot_table(index='city',values='deal',aggfunc=np.sum)   #分城市求和
city_sales.sort_values('deal',inplace=True,ascending=False)
city_sales=city_sales.reset_index()
city_sales=city_sales[:30]

index=np.arange(city_sales.deal.size)
plt.figure(figsize=(12,4))
plt.bar(index,city_sales.deal)
plt.xticks(index,city_sales.city,rotation=0)    #让字体横向分布
plt.xlabel('城市',fontsize=12)
plt.ylabel('销量总和',fontsize=12)
plt.title('不同城市的商品销量之和',fontsize=12)

【分析4】分析地域差异
1、福建的零食商品数量最多(难道是受沙县小吃主导?),上海次之;
2、湖北虽然在售商品数量较少,但湖北的平均销量却最高。城市以武汉和上海销量最强;
3、在【分析1】中强势霸榜的川渝美食销量却一般,叫好不叫座?
4、销量高的城市大多是南方经济较发达的城市,经济能带动美食?南方零食比北方零食更畅销,猜测南方零食应该种类更加丰富。
【后记】鉴于有许多同学私信我要stop.csv(即停用词文件,这个文件可以自己设定停用词,也可以去网上找常用停用词),因此我将“stop.csv”和“淘宝美食35页”两个文件上传
链接:https://pan.baidu.com/s/1UYr3kkFcNmjipaR9XSJeiQ
提取码:gzfq